Introduction
Pearson’s correlation is a statistical measure of the linear relationship between two variables. Mathematically, it is the ratio of covariances of the two variables And the product of their standard deviations. Therefore the formula for Pearson’s correlation can be written as follows:

The result for Pearson’s correlation always varies between -1 and + 1. Pearson’s correlation can only measure linear relationships and it does not apply to higher-order relationships which are Non-linear in nature.
Assumptions for Pearson’s correlation
Following are the assumptions for proceeding to data analysis using Pearson’s correlation:
- Independent of the case: Pearson’s correlation should be measured on cases that are independent of each other. For example, it does not make sense to measure Pearson’s correlation for the same variable measured in two different units or with the same variable itself. even if Pearson’s correlation is measured for a variable that is not independent of the other variable there is a high chance that the correlation will be a perfect correlation of 1.
- Linear relationship: The relationship between two variables can be assessed for its linearity by plotting the values of variables on a scatter diagram and checking if the plot yields a relatively straight line. The picture below demonstrates the difference between the trend lines of linear relationships and nonlinear relationships.

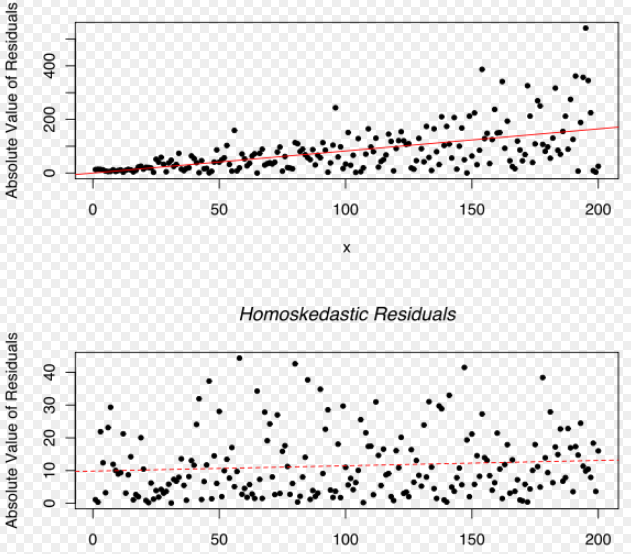
- Homoscedasticity: Two variables show homoscedasticity if the variances of the two variables are equally distributed. It can be evaluated by looking at the scatter plot of Residuals. The scatterplot of the residuals should be roughly rectangular-shaped as shown in the picture below.
Properties of Pearson’s Correlation
- Limit: Coefficient values can range from +1 to -1, where +1 indicates a perfect positive relationship, -1 indicates a perfect negative relationship, and a 0 indicates no relationship exists..
- Pure number: Pearson’s correlation comes out to be a dimensionless number because of its formula. Hence its value remains unchanged even with changes in the unit of measurement. For example, if one variable’s unit of measurement is in grams and the second variable is in quintals, even then, Pearson’s correlation coefficient value does not change.
- Symmetric: The Pearson’s correlation coefficient value remains unchanged for the relationship between X and Y or Y and X, hence it is called a Symmetric measure of a relationship.
Positive correlation
Pearson’s correlation coefficient indicates a positive relationship between two variables if its value ranges from 0 to 1. This means that when the value of one of the variables among the two variables increases, the value of the other variable increases too.
An example of, a positive correlation is a relationship between the height and weight of the same individual. Because naturally the increase in height is associated with the increase in length of bones of the individual, and the larger bones would contribute to the increased weight of the individual. Therefore, if Pearson’s correlation for height and weight data of the same individual is calculated, then it would indicate a positive correlation.
Negative correlation
Pearson’s correlation coefficient indicates a negative relationship between two variables if its value ranges from 0 to -1. This means that when the value of one of the variables among the two variables increases, the value of the other variable decreases.
An example of a negative correlation between two variables is the relationship between height above sea level and temperature. The temperature decreases as the height above the sea level increase therefore there exists a negative relationship between these two variables.
Degree of correlation:
The strength of the relationship between two variables is measured by the value of the correlation coefficient. The statisticians use the following degrees of correlations to indicate the relationship:
- Perfect relationship: If the value is near ± 1, then there is a perfect correlation between the two variables as one variable increases, the other variable tends to also increase (if positive) or decrease (if negative).
- High degree relationship: If the correlation coefficient value lies between ± 0.50 and ± 1, then there is a strong correlation between the two variables.
- Moderate degree relationship: If the value of the correlation coefficient lies between ± 0.30 and ± 0.49, then there is a medium correlation between the two variables.
- Low degree relationship: When the value of the correlation coefficient lies below + .29, then there is a weak relationship between the two variables.
- No relationship: There is no relationship between two variables if the value of the correlation is 0.
Pearson’s Correlation in Multivariate Data Analysis
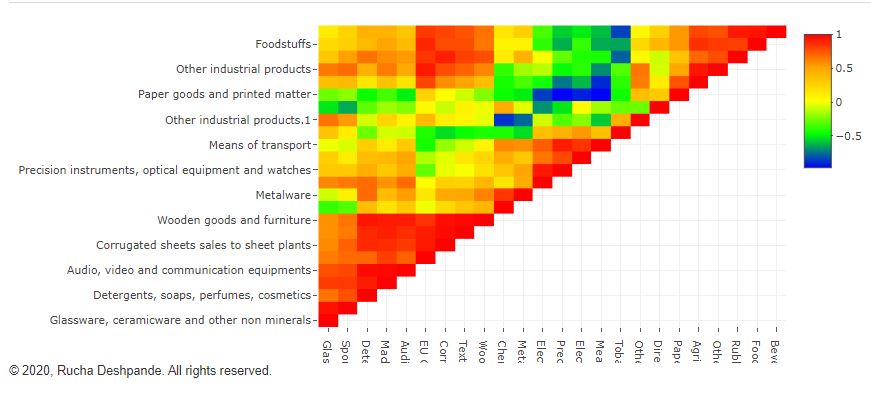
In addition to finding relationships between two variables, Pearson’s correlation is also used to understand the multicollinearity in the data for multivariate data analysis. This is because the suitability of the data analysis method depends on the multicollinearity within the data set. If there is high multicollinearity within the data then Multivariate Data Analysis techniques such as Partial Least Square Regression, Principal Component Analysis, and Principal Component Regression are most suitable for modeling the data. Whereas, if the data doesn’t show a multicollinearity problem, then it can be used for data analysis using multiple linear regression and linear discriminant analysis. That is the reason why you should take a good look at your Pearson correlation Matrix while choosing data analytics models using the DataPandit platform. Read this article to know more about how to use the correlation matrix in DataPandit.
Conclusion
Pearson’s correlation coefficient is an important measure of the strength of the relationship between two variables. Additionally, it can be also used to assess the multicollinearity within the data.
Did you know that Let’s Excel Analytics Solutions provides free access to its analytics SaaS applications for research and training purposes? All you have to do is fill up this form if you are interested.