
The correlation matrix in DataPandit shows the relationship of each variable in the dataset with every other variable in the dataset. It is basically, a heatmap of Pearson correlation values between corresponding variables.
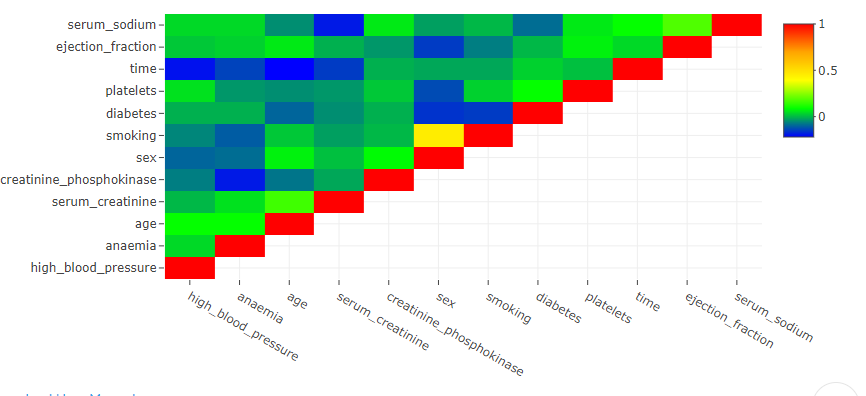
For example, in the correlation matrix above, the first element on X-axis is high_blood_pressure while that on the Y-axis is high_blood_pressure too. Therefore, it should show a Perfect correlation with itself with Pearson’s correlation coefficient value of 1. If we refer to the legend at the top right side of the correlation matrix, we can see that Red Color shows the highest value (1) in the heatmap while the blue color shows the lowest value in the heatmap. Theoretically, the lowest possible value for Pearson’s correlation is -1. However, the lowest value in the heatmap may vary from data to data. However, every heatmap will show the highest correlation value of 1 owing to the presence of the diagonal elements.
The diagonal elements of the correlation matrix are the relationship of each variable with itself and hence show a perfect relationship (Pearson’s Correlation Co-efficient of 1).
However, it doesn’t make much sense to see the relationship of any variable with itself. Therefore, while analyzing the correlation matrix treat these diagonal elements as points of reference.
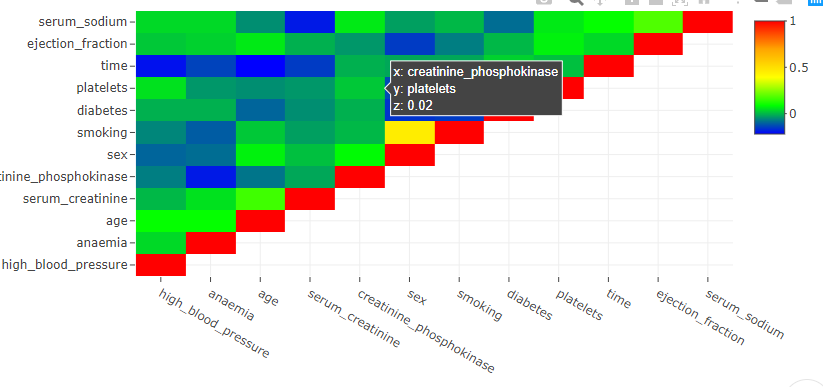
You can hover over the matrix elements to see the X and Y variable along with the numerical value of Pearson’s correlation coefficient to know the exact coordinates.
There are options to zoom in, zoom out, add toggle spikes, autoscale and save the plot at the top right corner of the plot. Toggle spikes draws perpendicular lines on the X and Y axis and shows the exact coordinates with value of Pearson’s correlation.
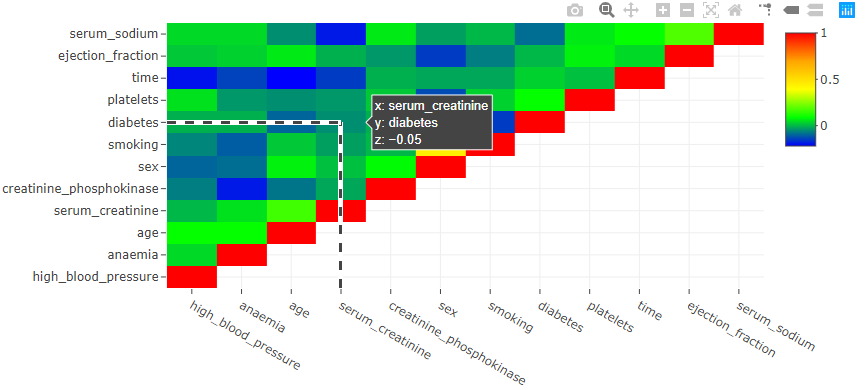
In the above correlation matrix, the toggled spike lines show that diabetes and serum_creatinine have a Pearson’s correlation coefficient of -0.05 indicating no relationship between the two variables.
Read our blog post here to know more about Pearson’s correlation. Apply here if you are interested in obtaining free access to our analytics solutions for research and training purposes?