Technology has been evolving very expeditiously over the past decade. These advancements have set off a trend for learning with technology. To satisfy the learning needs, people are embracing self-directed learning. It is important to mention that as the world is preparing for the Fourth Industrial Revolution (I4.0), the workforce has to keep up with the advancements in technology. At the same time, there has been quite a buzz around the Machine Learning and Artificial Intelligence that forms the heart and soul of the I4.0. In other words, learning Machine Learning is the need of the hour.
Now that it is imperative to learn Machine Learning, there are three success mantras of mastering it: PRACTICE, PRACTICE, and PRACTICE. But the basic question that comes up in our mind is, what to practice on. A true dataset should be available to work on as if dealing with a real ML problem. In this blog, we will be discussing some of the most popular data repositories for extracting sample datasets for mastering Machine Learning skills.
Data, DataSet, and Databases
Before we begin, it’s important to clear the air by defining the basic definitions related to datasets.
What is data?
Data is a collection of information that is based on certain facts.
What is a dataset?
Dataset is a structured collection of data.
What is a database?
The database is an organized collection of multiple datasets.
The data which is used can be collected from various sources such as experimentations, surveys, polls, interviews, human observations, etc. It can also be generated by machines and directly archived into databases.
DataSets For Machine Learning Projects
The choice of data collection is a very crucial step in the success of the Machine Learning program. The source of the datasets is equally important, as it is a matter of the reliability and trueness of the collected data. Some of the most popular data repositories that are required for acquiring Machine Learning datasets are discussed below.
KAGGLE
This platform is owned by Google LLC and is a repository of huge data sets and code that is published by its users, the Kaggle community. Kaggle also allows its users to build models with the Kaggle datasets. The users can also discuss the problems faced in analyzing the data with its user community.
Kaggle also provides a platform for various open-source data Science courses and programs. It is a comprehensive online community of Data Science professionals where you can find solutions to all your data analytics problems.
UCI MACHINE LEARNING REPOSITORY
UCI Machine Learning repository is an open-source repository of Machine Learning databases, domain theories, and data generators. This repository was developed by a graduate student, David Aha, at the University of California, Irvine (UCI) around 1987. Since then, the Centre for Machine Learning and Intelligent Systems at the UCI is overseeing the archival of the repository. It has been widely used for empirical and methodological research of Machine Learning algorithms.
QUANDL
Quandl is a closed-source repository for financial, economic, and alternative datasets used by analysts worldwide to influence their financial decisions. It is used by the world’s topmost hedge fund, asset managers, and investment banks.
Due to its premiere and closed-source nature, it cannot be used for just practicing Machine Learning algorithms. But citing its specialization in financial datasets, it is very important to include Quandl in this list. Quandl is owned by NASDAQ, American Stocks Exchange based in New York City.
WHO
World Health Organisation (WHO) is a specialized agency of the United Nations Organisation headquartered in Geneva, Switzerland. It is responsible for monitoring international health and continually collects data related to health across the world. WHO has named its repository of data as Global Health Observatory (GHO). The GHO data repository collects and archives health-related statistical data of its 194 member countries.
If you are looking for developing Machine Learning algorithms on health-related problems, GHO is one of the best sources of data collection. It is a repository of a wide variety of information ranging from a particular disease, epidemics, and pandemics, world health programs, and policies.
GOOGLE DATASET SEARCH
Google dataset search is a search engine for datasets powered by Google. It uses a simple keyword search to acquire datasets hosted in the different repositories across the web. It hosts around 25 million publicly available datasets to its users. Most data in this repository is government data besides a wide variety of other datasets.
AMAZON WEB SERVICES (AWS)
Amazon Web Services is known as the world’s largest cloud services provider. AWS has a registry of datasets that can be used to search and host a wide variety of resources for Machine Learning. This repository is cloud-based, allowing users to add and retrieve all forms of data irrespective of the scale. AWS also enables data visualization, data processing, and real-time analytics to make well-informed decisions driven by data.
Conclusion
The human resources are prepping up for Workforce 4.0 by constantly acquiring new skills. Machine Learning is one of the most indispensable skills for tomorrow’s workforce. In today’s world of the digital revolution, information is available at our fingertips. The datasets for Machine Learning are also available as open-source and could be utilized to build algorithms for making informed decisions.
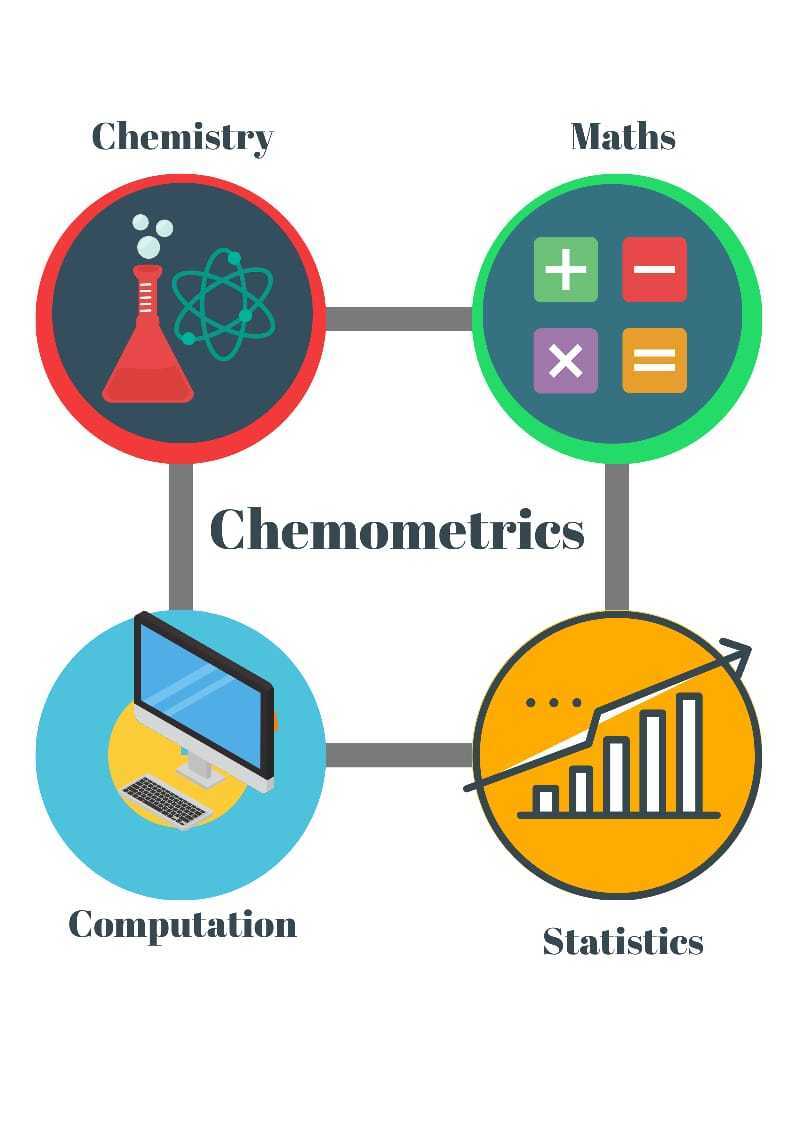
“Chemometrics” is a combination of two words “chemo” and “metrics” which signifies the application of computational tools to Chemical Sciences. Coined by a Swedish Scientist, Svante Wold, in 1972. Later in 1974, Svante Wold and Bruce Kowalski founded the International Chemometrics Society (ICS). ICS describes chemometrics as the chemical discipline that uses mathematical and statistical models to a) design or select optimal measurement procedures and experiments, and b) to provide maximum chemical information by analyzing chemical data.
How does Chemometrics help design optimal experiments
Classical chemistry depends on the conventional One-factor-at-a-time (OFAT) for building on the understanding of the process chemistry, performance of the process, and product characterizations. However, these conventional techniques suffer from many drawbacks such as:
OFAT studies are time-consuming and need a greater number of experimental
It does not give any information about potential interactions between the two or more factors, and
OFAT studies may or may not give the optimal settings for the process or the product attributes.
The chemometrics, in turn, employs multivariate mathematical and statistical tools in combination with computational techniques to investigate the effect of multiple factors on the optimality of the process and product attributes. The multivariate data is modeled into a mathematical equation that can predict the best optimal settings for the process and the effect of the excursions of the process parameters on the process performance and the product quality.
The outcome of the multivariate investigation allows identification of the multidimensional design space within which the process is not impacting the process performance and product quality attributes. Moreover, multivariate strategies cover multiple process insights into a single multivariate design of the experiment. The adoption of the multivariate design of experiments offers multiple advantages over the conventional OFAT like:
Reduces the product development timelines significantly,
Significantly reduce the product development costs in a highly competitive market.
Maximizes the total information obtained from the experiment.
How does Chemometrics help derive maximum information from the chemical data?
The multivariate analysis strategy in the analysis of the chemical data starts with the pretreatment of the chemical data, also known as data preprocessing. It involves the approaches, where:
The data is scaled and coded,
Cleaned for outliers,
Checked for errors and missing values, and
Transformed, if need be, into a format that is explicitly comprehensible by the statistical and mathematical algorithms.
After the preprocessing of the data, the chemometric tools look for the patterns and informative trends in the data. This is referred to as pattern recognition. Pattern recognition uses machine learning algorithms to identify trends and patterns in the data. These machine learning algorithms, in turn, employ the historical data stored in the data warehouses to predict the possible patterns in the new set of data. The pattern recognition ML tools use either supervised or unsupervised learning algorithms. The unsupervised algorithms include Hierarchical Cluster Analysis (HCA) and Principal Components Analysis (PCA) whereas supervised algorithms have K Nearest Neighbours (KNN).
What are the Different Tools and Techniques used in Chemometrics?
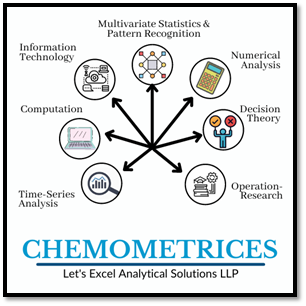
With advancements in time, chemometrics has added multiple feathers in its cap rather than being a single tool for its application in the Chemical Sciences. A wide variety of the disciplines that contributed to the advancements of the field of Chemometrics are shown in the figure below. It has been adding multiple techniques each time to expand its applicability in the Research & Development of the chemical sciences.
Multivariate Statistics & Pattern Recognition in the Chemometrics
Multivariate statistical analysis refers to the concurrent analysis of multiple factors to derive the totality of the information from the data. The information derived may be the effect of individual factors, the interaction between two or more factors, and the quadratic terms of the factors. As multivariate data analysis involves estimation of almost all the possible effects in the data, these analysis techniques have very high precision and help make highly predictable conclusions. The multivariate statistical tools and techniques find plenty of applications in following industries:
Pharma and Life Sciences
Food and Beverages
Agriculture
Chemical
Earth & Space
Business Intelligence
Some of the most popular and commonly used multivariate modelling approaches are described briefly below.
Principal Components Analysis
Data generated in chemometrics, particularly in spectroscopic analysis, is enormous. Such datasets are highly correlated and difficult to model. For that matter, Principal Components Analysis (PCA) creates new uncorrelated variables known as principal components. PCA is a dimensionality reduction technique that enhances the interpretability of large datasets by transforming large datasets into smaller variables without losing much of the information. Let’s Excel Analytics Solutions LLP offers a simple yet highly capable web-based platform for PCA, branded as the MagicPCA.
Linear Discriminant Analysis
Linear discriminant analysis is another multivariate technique that is dependent on dimensionality reduction. However, in LDA the dependent variables are categorical variables and the independent variables could be in the form of intervals. The LDA focuses on establishing a function that can distinguish between different categories of the independent variables. This helps identify the sources of maximum variability in the data. Our experts at Let’s Excel Analytics Solutions LLPhave developed an application, namely niceLDA, that can solve your LDA problems.
Partial Least Squares
Partial Least Squares (PLS) is a multivariate statistical tool that bears some resemblance with the Principal Components Analysis. It reduces the number of variables to a smaller set of uncorrelated variables and subsequently performs linear regression on them. However, unlike linear regression, PLS fits multiple responses in a single model. Our programmers at Let’s Excel Analytics Solutions LLP have developed a user-friendly web-based application for partial least square regression, EasyPLS.
Application of Chemometrics in Analytical Chemistry
Chemometrics finds its application throughout the entire lifecycle of the Analytical Sciences right from the method development and validation, development of the sampling procedure, exploratory data analysis, model building and, predictive analysis. The analytical data generated has a multivariate nature and depends on the multivariate data analysis (MVDA) for the exploratory analysis and predictive modeling. The three main areas of the Analytical Sciences where Chemometrics has demonstrated its advantages over the conventional techniques include:
Grouping or cluster analysis refers to a group of analyses where a data set is divided into various clusters in such a way that each cluster has a unique and peculiar property that differs from another set of clusters. A widely known example of cluster analysis is used in flow cytometric analysis of cell viabilities where cells are clustered based on the apoptotic markers. Principal Component Analysis can be used as a powerful tool for understanding the grouping patterns.
Classification analysis is defined as a systematic categorization of chemical compounds based on known physicochemical properties. This allows for the exploration of the alternatives for a known chemical compound with similar physicochemical properties. For example, in the development of the HPLC method for polar and aromatic compounds, data mining for the corresponding solvents can be done by looking into polar and aromatic classes of the solvents. This can be done by building SIMCA models on top of the Principal Component Analysis.
Calibration of the analytical methods: chemometrics-assisted calibration of analytical methods employ multivariate calibration models where multiple, sometimes hundreds, analytes are calibrated at the same time. These multivariate calibration models have many advantages over the conventional univariate calibration models. The major advantages include:
significant reduction of noise,
non-selectivity of the analytical methods,
dealing with interferents and,
outliers can be detected and excluded in the first place.
The Principal Components Analysis and Partial Least Squares are the most commonly used chemometrics tools that are used for developing multivariate calibration models in the development of analytical methods for pharmaceuticals, foods, environmental monitoring, and forensic sciences. The chemometric tools have widely transformed the discipline of the Analytical Sciences by building highly reliable and predictive calibration models, providing tools that assist in their quantitative validations, and contributing to their successful application in highly sensitive chemical analyses.
Application of Chemometrics in Studying QSAR in Medicinal Chemistry
QSAR stands for “quantitative structure and activity relationship” and refers to the application of a wide variety of computational tools and techniques used to determine the quantitative relationship between the chemical structure of a molecule and its biological activities. It is based on the principle that each chemical moiety is responsible for a certain degree of biological activity in a chemical molecule and influences the activity of other moieties in the same molecule. In other words, the similarities in the structure of two chemical molecules could correspond to their similarities in biological activities. This forms a basis for predicting the biological activities of new drug molecules in medicinal chemistry.
For QSAR modeling, certain features of a chemical molecule that can potentially affect the biological activities are referred to as molecular descriptors. These molecular descriptors are classified into five major categories and include physicochemical, constitutional, geometric, topological, and quantum chemical descriptors. The biological activities of interest in QSAR correspond to the pharmacokinetic, pharmacodynamic, and toxicological properties of the molecule. Each of the molecular descriptors is referred to as the predictor and the corresponding biological activity as the response. The predictors are then modeled into a mathematical equation using multivariate statistical tools. There are two widely accepted statistical models used for predicting the QSAR of a new molecule and include regression and classification models. The regression models used are multiple linear regression (MLR), principal components regression (PCR), and Partial Least Square regression (PLS). Let’s Excel Analytics Solutions LLP has developed user-friendly interfaces for performing all these operations.
QSAR also has extended its approaches to other fields like chromatography (Quantitative Structure and Chromatography Relationship, QSCR), toxicology (Quantitative Structure and Toxicity Relationship, QSTR), biodegradability (Quantitative Structure and Biodegradability Relationship, QSBR), electrochemistry (Quantitative Structure and Electrochemistry Relationship, QSER) and so on.
Conclusion
Chemometrics has changed the way of designing and developing chemical processes. The information obtained from chemical data has maximized the degree to which processes can be optimized. It has also contributed significantly to the development of highly sensitive and accurate analytical methods by simplifying the complex amount of data generated during the development, calibration, and validation of the analytical data. In general, chemometrics is an ever-expanding domain that is constantly diversifying its applications in a wide variety of fields.
Let’s Excel Analytics Solutions LLP has a proven track record of developing highly reliable chemometric applications that can help you make better business decisions. If you are dealing with a complex problem and looking for the right solution, schedule a free consultation now!
Data Science related terminologies are buzzing around the internet. It marks the onset of the Industry 4.0 revolution. Data Science is a discipline that studies big data, uses modern tools and techniques for data mining and data analysis to find its applications across a wide variety of domains. For example, Google AI retinal scan collected retinal images from thousands of patients across South India. Finally, it analyzed the data to get information about the patients’ disposition to cardiovascular diseases in the next five years.
The statisticians, chemometricians and mathematicians have been breathing and living the data science concepts for years and may not be calling these terms with exactly the same buzz words. Perhaps the spread of the new terminologies is an outcome of massive online Data Science courses or the rebranding strategies of various companies that are trying to bank on the ‘Data Science’ capabilities. Whatever be the reason we need to prepare ourselves for the Industry 4.0 revolution, we should get familiar with these new terms. In this article, we broadly segregated the meaning of these terminologies based on interaction with various clients.
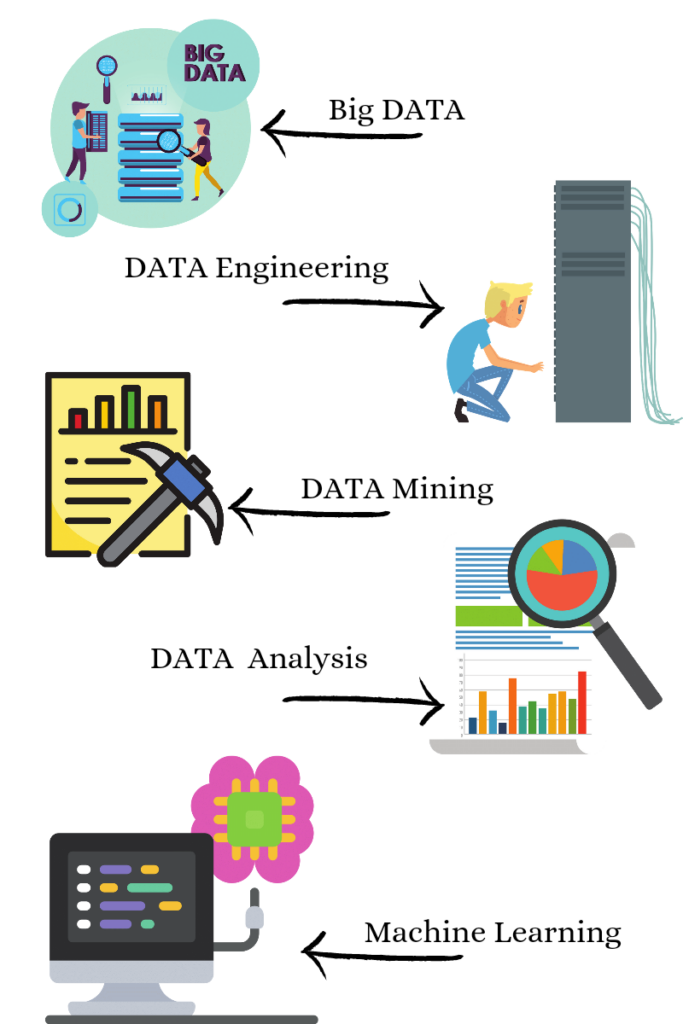
Big Data
Big data, put simply, refers to a collection of data from a wide variety of sources at a colossal scale. The data collected may be quantitative or qualitative, unknown or known, structured or unstructured and so on. As the scale of data collected is enormous, it is stored in specialized databases, known as big databases, that are developed using advanced computer programs such as SQL, MySQL etc. The collections of big data are also referred to as data warehouses. Many big databases are open source, e.g., Cassandra, HBase, MongoDB, Neo4j, CouchDB, OrientDB, Terrstore, etc. However, most of the popular databases are big-budgeted as well, e.g., Oracle, MySQL, Microsoft SQL, SAP HANA, etc. It is essential to state that the database choice is the fundamental and most critical step in the Data Science workflow. The storage requirements of the Big Data can range anywhere between MBs to TBs. Sometimes the data volume may be small, but the data complexity can be high. That is where data engineers pitch in to make things easy.
Data Engineering
The process of building a workflow to store the data in Big Data Warehouse and then extracting the relevant information is called Data Engineering.
Data Mining
Data mining is the process of extracting patterns from large datasets by combining methods from statistics and machine learning with database management. These techniques include association rule learning, cluster analysis, classification, and regression. Applications include mining customer data to determine segments most likely to respond to an offer, mining human resources data to identify characteristics of most successful employees or market basket analysis to model customers’ purchase behaviour.
Data Analysis
Data analysis is the exercise of analyzing, visualizing, and interpreting data to get relevant information that helps organizations make informed business decisions. It also involves data cleaning, outlier analysis, data preprocessing, and transformation to make data amenable to analysis. Data analysis is a very broad term that encompasses at least five different types of analyses. A data scientist chooses the most appropriate data analysis method based on the end goal of the analysis. Sometimes the same method of analysis can be used for the different end goal. Hence, another name may be used to call the technique despite involving the same mathematical and statistical concept. Therefore data analysis takes up various forms described briefly as below:
Descriptive statistical analysis is the fundamental step for performing any data analysis. It is also known as summary statistics and gives an idea of the basic structural features of the data like measures of central tendency, dispersion, skewness, etc.
Inferential statistical analysis is a type of statistical analysis that uses the information contained in a sampled data to make inferences about the corresponding larger population. It uses hypothesis testing of the data to draw statistically valid conclusions about the population. As the sampling process is always associated with an element of error, statistical analysis tools should also account for the sampling error so that a valid inference is drawn from the data.
Chemometrics is the science of extracting and analyzing Physico-chemical information by using spectroscopic sensors and other material characterization instruments. Chemometrics is interdisciplinary, using methods frequently employed in core data-analytic disciplines such as multivariate statistics, applied mathematics, and computer science to address problems in chemistry, biochemistry, medicine, biology, food, agriculture and chemical engineering. Chemometrics generally utilizes information from spectrochemical measurements such as FTIR, NIR, Raman and other material characterization techniques to control product quality attributes. It is being used for building Process Analytical Technology tools.
Predictive analysis models patterns in the big data to predict the likelihood of the future outcome. The models built are less likely to have 100% accuracy and are always associated with an intrinsic prediction variance. However, the data’s accuracy is refined each time more and more data is taken into account. Predictive analysis can be performed using linear regression, multiple linear regression, principal component analysis, principal component regression, partial least square regression, and linear discriminant analysis.
Diagnostic analysis, as the name suggests, is used to investigate what caused something to happen. The diagnostic analysis uses the historical data to look for the answers that caused the same something in the past. It is more of an investigative type of data analysis. This involves four main steps: data discovery, drill down, data mining and correlations. Data discovery is the process of identifying similar sources of data that underwent the same sequence of events in the past. Data drill down is about focusing on a particular attribute of the data that interests us. This is followed by data mining activity that ends with looking for strong correlations in the data to lead us to the event’s cause. Diagnostic analysis can be performed using all techniques mentioned for predictive analysis. However, the end goal of the diagnostic analysis is only to identify the root cause to improve the process or product.
Prescriptive analysis is the sum of all the data analysis techniques discussed above, but this form of analysis is more oriented towards making and influencing business decisions. Specifically, prescriptive analytics factors information about possible situations or scenarios, available resources, past performance, current performance and suggests a course of action or strategy. It can be used to make decisions on any time horizon, from immediate to long term.
Data Analytics
Data analytics is the sum of all the mentioned activities, right from big data, data engineering, data mining to the analysis of the data.
Machine Learning
Machine Learning creates new programs that can predict future events with little supervision by humans. Machine learning analytics is an advanced and automated form of data analytics. A Machine Learning algorithm is called Artificial Intelligence when the prediction accuracy is improved each time new data is added to it.
Machine learning algorithms that uses layered networks capable of unsupervised learning from the data are called Deep Learning algorithms. Examples of Deep Learning algorithms include Deep neural networks or Artificial Neural Networks inspired by the brain’s structure and function. These type of algorithms are designed to be analogous to human intelligence. The major difference between machine learning and deep learning is human supervision, i.e., deep learning algorithms are a completely unsupervised form of learning in contrast to machine learning algorithms.
Conclusion
The field of Data Science is more oriented towards the application side of the modern AI/ML tools that employ advanced algorithms to build predictive models that can transform the future of what we do and how we do it.
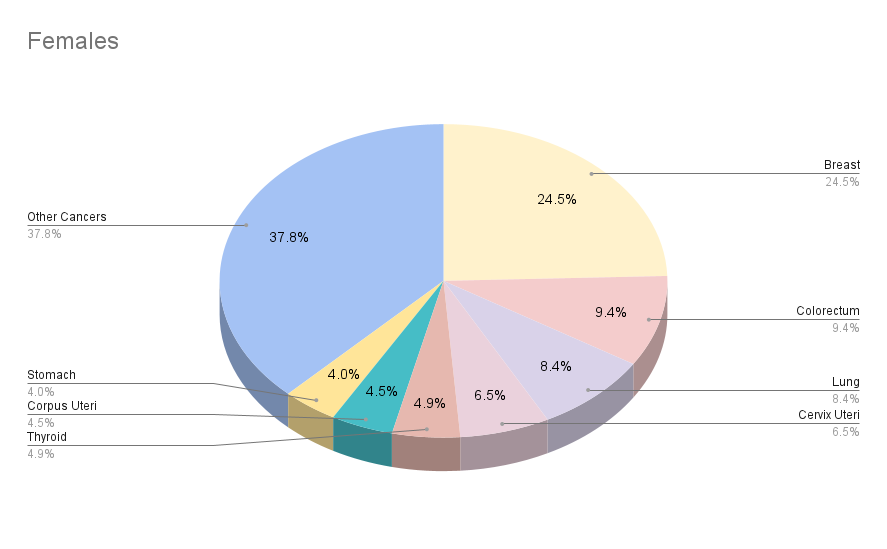
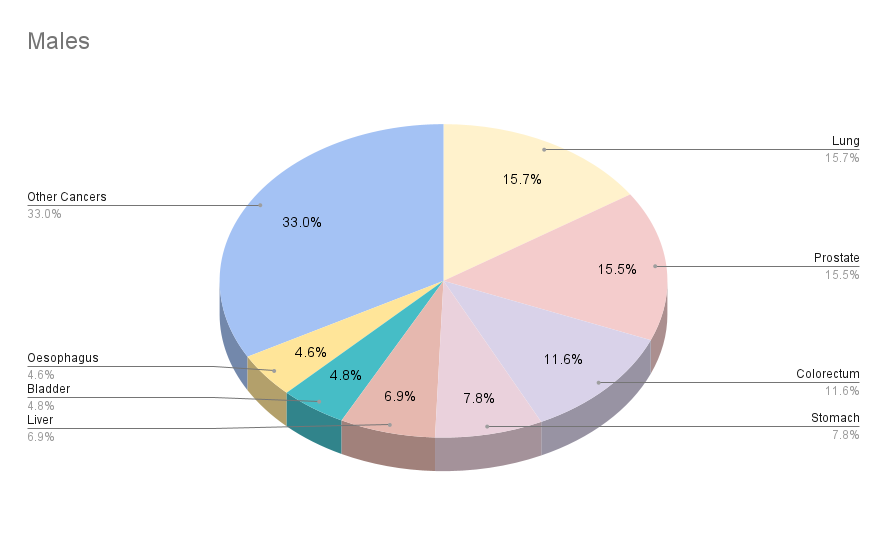
GLOBOCON 2020, one of the key cancer surveillance projects of the International Agency for Research on Cancer (IARC), published recent statistics of global cancer epidemiology. According to this report, 19,292,789 new cancer cases were reported in 2020 i.e., a two-fold increase in the number of cases as reported in 2018. For over 19 million cases of cancer reported, 9,958,133 cancer-related deaths were reported in the same year. As per the estimates of the International Agency for Research on Cancer (IARC), every 1 person in 5 persons is likely to develop cancer during their lifetime. In this article we are going to discuss how Predictive Analytics can play a major role in changing Cancer Statistics.
Cancer Statistics: 2020
Males
Females
Population
3,929,973,836
3,864,824,712
Number of new cancer cases
10,065,305
9,227,484
Number of cancer deaths
5,528,810
4,429,323
5 year prevalent cases
24,828,480
4,429,323
Top 5 most cancers excluding non-melanoma skin cancer
These alarming and constantly rising figures have refocused the attention of medical scientists on the early screening and diagnosis of cancers using Predictive Analytics. Because cancer mortality and morbidity can be reduced by early detection and treatment of cancer.
American Cancer Society (ACS) issues updated guidelines and guidances related to an early screening of cancers to assist in making well informed decisions about the tests for early detection of some of the most prevalent cancers (breast cancer, colon and rectal cancer, cervical cancer, endometrial cancer, lung cancer, and prostate cancer). The early detection of precancerous lesions and cancers is broadly divided into three categories:
Early cancer diagnosis
Cancers respond very well to the treatment only if diagnosed early that, in turn, increases the chances of cancer survival. As per WHO guidance, early diagnosis is a three-step process that must be integrated and provided in a timely manner.
Awareness of cancers and accessing care as early as possible
Clinical evaluation of cancers, appropriate diagnosis and staging of cancers
Access to the right treatment at the right stage.
Screening of cancers
Screening identifies specific markers of cancers that are suggestive of particular cancer. For example, visual inspection with Acetic Acid (VIA) test can be used for early screening of cervical cancers in women. Cervical lesions turn white for a few minutes after application of acetic acid.
However, the early diagnosis and screenings of cancer suffer from drawbacks like false positives, false negatives, and overdiagnosis which may lead to more invasive tests and procedures.To overcome this problem, scientists are using the power of Predictive Analytics based on Artificial Intelligence and Machine Learning.
Introduction to Artificial Intelligence (AI)
Artificial Intelligence (AI) is a great tool for Predictive Analytics and it is defined, in Webster’s dictionary, as a branch of computer science dealing with the simulation of intelligent behaviour in computers. In other words, it is the capability of machine to imitate intelligent human behaviour.
One of the early pioneers of Artificial Intelligence, Alan Turings, published an article in 1950 entitled “Computing Machinery and Intelligence.” It introduced the so-called, Turing test, to determine if a computer can exhibit the same level of intelligence as demonstrated by humans. The term “Artificial Intelligence” was coined by John McCarthy at the Artificial Intelligence (AI) conference at Dartmouth College in 1956. It was Allen Newell, J.C. Shaw, and Herbert Simon who introduced the first AI-based software program namely, The logic Theorist.
Majority of Artificial Intelligence (AI) applications use Machine Learning (ML) algorithms to find patterns in the datasets. These patterns are used to predict the future outcomes.
The basic framework of Artificial Intelligence (AI) consists of three main steps:
Collecting input data
Deciphering the relationship between input data
Identifying unique features of sample data
Introduction to Machine Learning (ML)
Machine learning (ML) is also another tool for Predictive Analytics and is defined in Webster’s dictionary as the process by which a computer is able to improve its own performance by continuously incorporating new data into an existing statistical model. It allows the system to reprogram itself as more data is added and eventually increasing the accuracy of the task assigned.
In the case of Machine learning (ML), it’s an iterative process so that the predictability of the system is improved each time. Most Machine Learning (ML) algorithms are mathematical equations in which sample data is plotted to observed variables, termed as features, and the outcomes termed as labels. The labels and features are used for the classification of different ML tools and techniques. Based on the label type, Machine Learning (ML) algorithms can be categorised into:
Supervised Learning
Unsupervised Learning
Reinforcement Learning
In supervised learning, models are trained based on labelled datasets. For the purpose of prediction, the model needs to map the input variables with the output variables using a know mathematical function. Supervised learning can be used for understanding, Classification and Regression problems.
In unsupervised learning, data patterns are found in the un-labelled data and the endpoint of the unsupervised learning is to find characteristics patterns in the data. Unsupervised learning is used for identifying Clustering and Association in datasets.
Reinforcement learning is the ‘learning’ by interacting with the environment. A reinforcement learning algorithm makes decisions based on its past experiences and also by making new explorations.
The PCA part of MagicPCA 1.0.0. is an unsupervised Machine Learning Approach, whereas the SIMCA part of it is a Supervised Classification Technique.
Rising Interest in Biomedical Research
In the initial years, the journey of AI was not so easy, as can be seen in the period of 1974-1980, which is known as AI winter. During this period the field experienced its low in terms of researcher’s interests and government funding. Today, after decades of advances in data management and superfast computers, and renewed interests of government and corporate bodies, it is a practical reality and finds its applications in a wide variety of fields like e-commerce, medical sciences, cybersecurity, agriculture, space science, automobile industry, etc.
As the phrase “Data Science is everywhere” picked up, biomedical researchers started delving into Artificial Intelligence (AI) and Machine Learning (ML) to look for a better solution through Predictive Analytics. One inspiring story of Regina Barzilay, a renowned professor of Artificial Intelligence (AI) and a breast cancer survivor, portrays how her diagnosis of breast cancer reshaped her research interests. She hypothesized that AI and ML tools can extract more clinical information that helps clinicians make knowledgeable decisions. She collected data from medical reports and developed Machine Learning algorithms to interpret the radio diagnostic images for clinicians. One of the models developed by her has also been implemented in clinical practice that helps radiologists to read diagnostic images very well.
Current scenario: Predictive Analytics in Cancer Diagnosis
The concept of AI/ML has long been employed as Predictive Analytics tool in the radiodiagnosis of precancerous lesions and tumours.
The AI system reads the images generated by various radiological techniques like MRI, PET scan, etc., and processes the information contained in them to assist clinicians make conscious decisions on the diagnosis and progression of the cancers.
Breast Cancer Diagnosis with QuantX
The FDA’s Center for Devices and Radiological Health (CDRH) has approved the first AI-based breast cancer diagnosis system for Predictive Analytics. QuantX was developed by Qlarity Imaging (Paragon Biosciences LLC). QuantX is described as a computer-aided (CAD) diagnosis software system that assists radiologists in the assessment and characterization of breast anomalies using Magnetic Resonance Imaging (MRI) data. The software automatically registers images and segmentations (T1, T2, FLAIR, etc.), and analyses user-directed regions of interest (ROI). QuantX extracts this data from the ROI to provide computer-aided analytics based on morphological and contrast enhancement characteristics. These imaging analytics are then used by an artificial intelligence algorithm to get a single value, known as QI score, which is analysed relative to the reference database. The QI score is based on the machine learning algorithm that is generated from a training subset of features calculated on segmented lesions.
Cervical Cancer Diagnosis with CAD
National Cancer Institute (NCI) has also developed a computer aided program (CAD) that analyses digital images taken of women’s cervix and identify potentially precancerous changes that require immediate medical attention. This Artificial Intelligence-based approach is called Automated Visual Evaluation (AVE). A large set of data, around 60000 cervical images, was generated using the precancerous and cancerous lesions to develop a machine learning algorithm. This algorithm recognizes patterns in visual images that lead to precancerous lesions in cervical cancers. The algorithm-based visualization of images has been reported to provide better insight into precancerous lesions, with a reported accuracy of 0.9, than routine screening tests.
Lung Cancer Diagnosis with Deep Learning Technique
NCI funded researchers of New York University used Deep Learning (DL) algorithms to identify gene mutations from pathophysiological images of lung tumors using Predictive Analytics. The pathophysiological images of lung tumours were collected from the Cancer Genome Atlas and used to build an algorithm that can predict specific gene mutations by visual inspections of the pathophysiological images. This method can very accurately predict the different types of lung cancers and the corresponding gene mutations from the analyses of the images.
Thyroid Cancer with Deep Convoluted Neural Network
Deep Convoluted Neural Network (DCNN) models were used to develop an accurate diagnostic tool for thyroid cancers by analysing images from ultrasonography. 1,31,731 ultrasound images from 17,627 patients with thyroid cancer and 1,80,668 images from 25,325 controls were collected from the thyroid imaging database of Tianjin Cancer Hospital. Those ultrasound images were modelled into a DCNN algorithm. The DCNN model showed similar sensitivity and improved specificity in identifying patients with thyroid cancer compared with a group of skilled radiologists.
AI/ML for Personalized Medicines
Researchers at Aalto University, University of Helsinki and the University of Turku developed a machine learning algorithm that can accurately predict how combinations of different antineoplastic drugs can kill various types of cancerous cells. This algorithm was obtained from data collected from a study that investigated the association between different drugs and their effectiveness in treating cancers. The model developed was found to show associations between different combination of drugs and cancer cells with high accuracy; the correlation coefficient of the model fitted was reported to be 0.9. This AI model can help cancer researchers to prioritize which combination of drugs to choose from a plethora of options for further research investigation. This depicts how AI and ML can be used for the development of personalized medicines.
Future challenges of AI/ML in cancer diagnosis
Data Science is shaping the future of the health care industry like never before. There has been a spurt of growing interests in AI and ML for the diagnosis of precancerous lesions and surveillance of cancerous lesions. The researchers are exploring to develop AI algorithms that help in the diagnosis of many other cancers. However, each type of cancer behaves differently and the consequent changes would be a significant challenge for the algorithms. Machine learning tools can overcome these challenges by training algorithm of these subtle changes. This would drastically improve decision making for clinicians.
One of the biggest challenges of the Artificial Intelligence today is the acceptance of the technology in the real world, particularly related to medical diagnoses of terminally ill patients where decision making plays a critical role in the longevity of the patient. The AI black box problem augments this problem further. AI black box refers to the fact that programmers can see input and output data only but how does an algorithm work is not known.
Regulatory aspects of AI/ML in cancer diagnosis
In 2019, US FDA publishing a discussion paper entitled “Proposed Regulatory Framework for Modifications to Artificial Intelligence/Machine Learning (AI/ML)-Based Software as a Medical Device (SaMD) – Discussion Paper and Request for Feedback.” The intention of FDA was to develop a regulatory framework for the medical software by issuing draft guidance on the Predetermined Change Control Plan outlined in the discussion paper. The Predetermined Change Control Plan mapped out a regulatory premarket review for AI/ML-based SaMD modifications.
In 2021, FDA published a draft guidance document entitled “Artificial Intelligence and Machine Learning (AI/ML) Software as a Medical Device Action Plan.” The FDA encouraged the development of the harmonized Good Machine Learning Practices of AI/ML-based SaMD through the participation of industrial and other stakeholders in consensus standards development efforts. This guidance was built upon the October 2020 Patient Engagement Advisory Committee (PEAC) meeting focused on patient trust in AI/ML technologies.
The FDA supports regulatory science efforts on the development of methodology for the evaluation and improvement of machine learning algorithms, including for the identification and elimination of bias, and on the robustness and resilience of these algorithms to withstand changing clinical inputs and conditions.
Conclusion
The employment of Predictive Analytics in cancer diagnosis has answered major challenges experienced in cancer diagnosis and treatment. It can help early screening of precancerous lesions and avert the mortality rate in cancer patients. AI/ ML provides accurate detection and prognosis of cancers, thereby reducing the incidents of false positives, false negatives and overdiagnosis. These techniques can also be used to track the prognosis of the cancers in the case of immunotherapies and radiotherapies. The AI/ ML has also potential applications in the development of personalized medicines by developing specific therapies for each specific cancers.
By detecting cancers early and accurately, prognosis of cancer treatment would be greatly improved. The early detections of cancers will have a huge impact on the cost-saving of the complicated cancer treatments. This could also have a huge impact on the cancer survival rates as the mortality rates could be drastically decreased on early detection of the cancers.
If you are struggling to make use of cancer data and need help to develop Machine Learning Models, then feel free to reach out to us. At Let’s Excel Analytics Solutions, we help our clients by developing cloud-based software solutions for predictive analytics using Machine Learning.
Predictive data science is no longer limited only to data scientists and engineers. Interested to explore what you can do in the food & beverage industry? Read this article to know how your competitors are leveraging predictive data science to improve their operations. Progress happens with each step taken. With the market becoming more competitive than ever, everyone is eager to find a breakthrough solution. According to a news report on CISION PR Newswire, the global food and beverages market reached a value of nearly $5,943.6 billion in 2019, having increased at a compound annual growth rate (CAGR) of 5.7% since 2015. The market is expected to grow at a CAGR of 6.1% from 2019 and reach $7,525.7 billion in 2023. Meaning that there are massive amounts of data just waiting to be analysed and processed for meaningful insights using predictive data science. Let us now see what data science and analytics can do for the food and beverage industry.
Predictive Data Science in Restaurant Industry:
When talking about the benefits of predictive data science in food, we cannot leave out restaurants. Restaurant owners do not seem to realize the tremendous amounts of data that is generated from their customers. Therefore, there are chances that they miss opportunities to decrease costs and improve customer experience. With the explicit and precise implementation of data science, restaurant owners can obtain real-time analysis of their customers’ data and make the required improvements. For instance, owners and founders can point out their highest selling or most expensive items, the quality of food offered, and more. Based on this data, they can make informed choices, and also fix their mistakes.
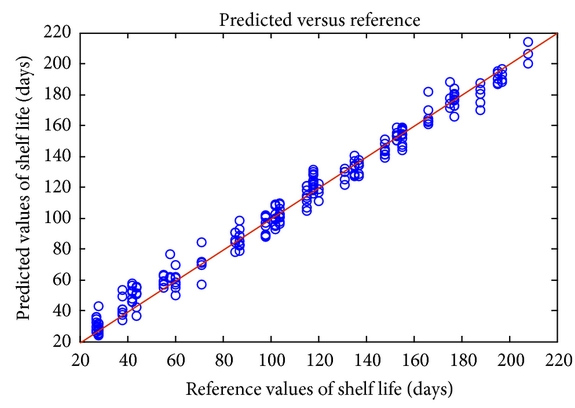
Predicting shelf life:
Each type of food has its own shelf-life, causing it to expire over time. However, there are certain items of consumption that only grow better with time. For instance, wine gets better with time, but fresh produce will expire. Different items of food and drink have different shelf lives and managing all of them independently is a major challenge for this industry. The procedure for dealing with wine is very different compared to the procedure for dealing with expired products. But, by incorporating predictive data science into the picture, data engineers can predict the shelf life of produce, thus ensuring pre-emptive action is taken to reduce the amount of waste and saving money and time.
Sentiment Analysis:
Social media, review websites and food delivery apps have allowed the food industry to do something that was not possible in the past, i.e., sentiment analysis. Using NLP, organizations can analyse their social media channels and discover patterns and trends in the data. This will allow them to discover the most popular foods and beverages of any season. It also allows them to discover the popular foods during special occasions and other festivities. Brands, restaurants, and organizations can, in turn, be more receptive to people’s demand and act accordingly. Google analytics can be a helpful medium in this case.
Better Supply Chain Transparency:
Let us now look at another example of how data analytics can benefit growers, transporters, processors, and food retailers:
Information about the weather is also entered into the database. Inputs about precipitation and temperatures can be automated.
The farmers enter the test results of the soil, along with the planting and harvesting data into a database used by a particular software program.
The logistics company that transports the farmer’s crop from the farm to the processing mill, inputs the start and end times for the trip in the database.
The food processor enters the start and stop times for various stages of the processing, sorting, washing, packaging, and placing in cold storage can all be tracked with automated sensors.
The product is then monitored from the processor to the retailer. Any delays that could cause the food to spoil can be easily identified.
At the destination, the vendor can record the quality of the food when it arrives,
Customer feedback on social media can also be added to the collected data, to provide further insight to the food supply chain.
The entire supply chain can access this information. If there arises any problems, changes can be made to this process to prevent a further recurrence. Moreover, retailers can choose to accept or reject the shipment based on this data. The software performs an analysis of the data and provides intelligent and accurate conclusions to all parties involved in the supply chain. Analytics software takes the help of a large number of sources for making its analysis, including social media. Both structured and unstructured data is used for the analysis. This collection of data is known as big data.
Measuring Critical Quality Attributes:
There are certain primary attributes against which the food and beverage industry measures the quality of its products. These attributes can be a great asset in marketing them – for example, the alcohol concentration in beer. However, conventional methods of measuring primary attributes are time-consuming. In case of beer, the alcohol level is measured using a method known as near-infrared spectroscopy. This method, however, is time-consuming and delays the production process. Predictive Data science and analytics allows organizations to explore other methods that are faster and more cost-effective, like the Orthogonal Partial Least Square Regression and multiple regression models to measure alcohol content and colour.
Better Health Management:
Consumers wish the food industry to be more transparent. The leading firms of the multi-billion-dollar beef industry realised this when they gathered for Beef Australia 2018, a convention that sees over 90,000 visitors. Consumers expect restaurants and organisations to be more forthright with them. They expect to be completely aware of how the food was produced, how the livestock was treated and what chemicals, if any, were used in the food. They want to be completely aware of what they are consuming. Data science and analytics helps incorporate transparency within these supply chains, so that organizations can be more honest with their customers. Transparency also assists in solving problems related to logistics and supply. For instance, it becomes easier to track contaminated food supplies to their storage locations, thus eliminating the chances of spread of food-borne diseases. Predictive data science and analytics allows organizations to protect food health and prevent cross-contamination. Geographical data, along with satellite data and remote sensing techniques, allows data analysts to ascertain changes. This information, along with data on temperature, soil property, and vicinity to urban areas, can predict which part of the farm is likely to be infected with pathogens, and take immediate action beforehand. Another excellent example is when cities are short on food inspectors – data analytics can analyse historical data on 13 key variables to help pinpoint the riskiest establishments, making better use of limited food inspectors.
Predictive Data Science for Food Innovations
Organizations need to keep pace with the changing demands of the consumers. With the fluctuation in their tastes according to season, time of day, weather, mood, etc, it becomes crucial for the organizations to take the assistance of predictive data science. This data is then converted into meaningful information which aids in making important decisions, as well as to improve sales and overall performances.
Food Marketing
Predictive data science also assists businesses in improving their marketing campaigns, developing creative and high demand products, and empowering firms to stay updated over their competition’s growth rate, control quality as well as assess decisions regarding purchasing and prices. The data also helps businesses keep track of certain crucial factors, like the quality of their products, by gauging if the composition of the product has been altered in any way.
Conclusion
Predictive data science and analytics has definitely brought about a positive growth in certain industries, including the food and beverage industry. This industry is prone to its fair share of difficulties. With the ever-growing population, consumers are always looking to choose the best option that they can get. Since the consumer is the key, organizations need to make decisions revolving around the consumers’ tastes. Data science enables businesses to derive conclusions about which option will be best suited for the consumers. It allows organizations to collect and analyse data and derive at interesting patterns and trends over a period of time. The technology can also be used to conceive several creative solutions to problems plaguing the industry while bringing positive developments to food and beverage.
Data is everywhere. From small businesses to large multinational organizations, data is used in almost every area of study and work. From the small mathematical problems solved by a child to the complex functions executed in large organizations, data is used almost everywhere.
Data is one of the most important components of any organization, because it assists leaders in making decisions based on absolute certainty, comprising of facts, statistical results and trends. Any result based on correct and concise data tends to be correct. Data can reveal a lot about an organization, and organizations rely heavily on this data.
Due to the growing relevance and importance of data, data science came into the picture. Data science is a multidisciplinary field. It uses algorithms, scientific procedures and approaches to derive conclusions from massive amounts of data. This data can be either structured or unstructured. In this article, we shall be looking at data science in the healthcare industry.
Data Analytics in Healthcare
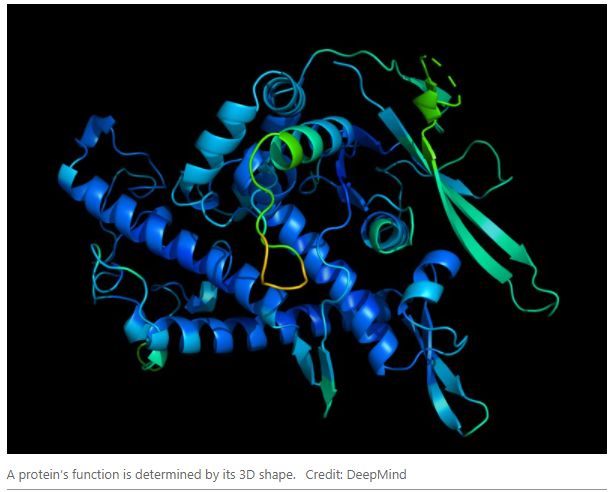
Medicine and healthcare are two of the most important components of our lives. Traditionally, medicine and medical advice was given solely by the doctors based on the patient’s symptoms. However, this was not always accurate and was prone to errors. With the advancements in the field of data science, it is now possible to obtain a more accurate diagnosis. The AI is being used not only as a tool for diagnosis but also for break through discoveries. In a latest advancement Google has achieved a huge success in unfolding protein structures. The very core of the problem that many biochemical Scientists were trying to solve from many decades!
Scientists have also developed ‘DNA Nanopore Sequencer’ which is a tool that helps patients before they suffer from septic shock. It provides genetic sequences mapping, which abbreviates the time span of the information preparing activity. Moreover, this tool recovers genomic information, BAM document controls, and provides calculations. The new health data science perspective allows applying data analytics, that are collected from various fields, to augment the healthcare sector. There are several areas in healthcare, such as drug discovery, medical imaging, genetics, predictive diagnosis and others which make full use of the results derived at through data science techniques. With ERM’s, clinical trials and internet research, there is so much data being accumulated every day. With the majority of people seeking healthcare advice online, gathering data has become increasingly convenient.
How can it work?
Let us now try to derive an insight into how data science and healthcare can become mutually beneficial.
Data management and Data Governance: The opportunities derived from managing data efficiently are extensive. When data is managed effectively, it makes information easily accessible to all those in the healthcare industry. When data is analysed and shared effectively among doctors and healthcare providers, it will enable them to be more personal and humane in their approach towards treatment. Since the healthcare sector has its fair share of risks, data analytics should always be at the top of its game; it should be up-to-date and acute. The Data related to Medical records, ongoing condition charts of patients, medical database, genetic research, medical image diagnoses can be effectively leveraged to unfold valuable information.
Each patient’s medical records can be combined into one dataset, and then analysed and utilised when needed, to derive at the required conclusions.
Data management also involves data sharing. Data can be shared across several datasets, eliminating the need for excessive office work.
When data is analysed repeatedly, it will bring out any and all errors in clinical data.
Cloud-based clinical software enables faster processing of data, leading to time saved when deciding on treatment or obtaining test results.
Machine learning assists in shortening the process of drug discovery.
Challenges ahead
While data governance has been recognized as crucial to healthcare, there are opportunities to expedite the prioritization of data governance, so that data is accurate, complete, structured, precise and available. Data governance plays a pivotal role in patient engagement, care coordination, and looking after the overall health of the community. If data is not governed properly, different healthcare companies will release inconsistent data which will prove to be a major hindrance. Healthcare data science apps exist in order to avoid such inconveniences.
Workflow Optimization and Process Improvements: Big data analytics is not as profound in healthcare. Hence, certain decisions are taken based on the ‘gut instinct’. Apart from this, lack of coherent healthcare information exchange between the systems and shortage of skilled workers to fill knowledge gaps are other two challenges involved in the process.
Opportunities Genetics/Genomics
Treatment personalization: With the introduction of new technologies, including new forms of genomic profiling or sequencing, it provides a new look at the world of genomics. The massive amounts of data today produce genetic data faster than ever. This is partly because the techniques of structuring data, lag behind the ability to actually get the data. Healthcare data science produces copious amounts of data, but that data needs to be made sense of. Some of the challenges in the field of genomics are:
Studying human genetic variation and its impact on patients
Identifying genetic risk factors for drug response
Opportunities in Medical Imaging
Medical Imaging: Medical imaging refers to the process of creating a visual representation of the body for medical analysis and treatment. If is a non-invasive method for doctors to look inside the human body and decide on the required treatment plan. With the swift growth of healthcare and artificial intelligence, this process of medical imaging becomes easier. Some of the types of medical imaging include tomography, longitudinal tomography etc. The primary methods of medical imaging are X-ray computer tomography (CT), PET, and MRI. Medical imaging needs the images to be absolutely accurate. Even minor discrepancies might lead to disastrous results, which can be catastrophic to the patients. The images need to be precisely viewed and interpreted. Data analysis refines these images by enhancing their characteristics like
Opportunities in Predictive Analytics
Predictive analytics refers to a technology that learns from experience, i.e. data, to predict a patient’s behaviour. It builds a connection between the data and the consequent actions which need to be taken based on that data. Predictive analytics allows healthcare to use predictive models or models found specifically in health data science. This allows identification of risks even before they occur. However, there are some drawbacks to predictive analytics.
Predictive analytics is already being used in healthcare manufacturing to meet safety and efficacy requirements of drug products and medical devices.
Opportunities in Drug Research
If we look back to the time of another major pandemic, the Spanish Flu, we see that drugs and vaccines took a considerable amount of time. But now, with the help of data science, data from millions of test cases can be processed within weeks. Development of vaccines and other drugs has become easier and less time-consuming.
How can Let’s Excel Analytics Solutions help here
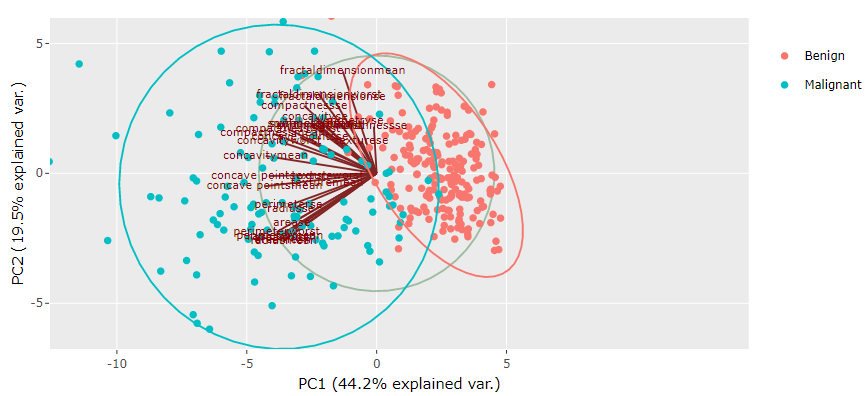
We at Let’s Excel develop easy-to-use software interfaces using Artificial Intelligence and Machine Learning algorithms to take healthcare research to next level with data science. Below is an example of the diagnosis of a tumor as benign or malignant using DataPandit‘s MagicPCA solution.
Advantages
Lesser time taken and more precise outcomes lead to more effective work processes.
Healthcare providers and other staff get the chance to perform more tasks in limited time.
More effective work processes lead to higher recovery rates, faster reactions to crises and, in turn, less fatal results.
Patients get more personalized treatments.
Conclusion
Healthcare has a vast amount of data being generated every day. This data needs to be made sense of, it needs to be structured and organized so that meaningful conclusions can be derived at from the data. The healthcare industry needs to heavily utilize this data so that patients’ lifestyle can improve, diseases can be predicted before their inception. Moreover, with medical imaging analysis, it is now possible for doctors to find even the most microscopic tumours. Doctors can also monitor the conditions of their patients from remote locations.
Data science is already doing wonders for the healthcare industry. It is only a matter of time before it proves itself to be invaluable.