Introduction
- Multiple linear regression is a statistical method used to analyze the relationship between a dependent variable and multiple independent variables. It is an extension of simple linear regression, which involves only one independent variable.The goal is to identify the linear relationship between the dependent variable and two or more independent variables.
- Our SaaS Cloud Platform will provide a web-based solution useful to estimate the relationship between two or more independent variables and one dependent variable when the variables follow the normality assumptions.
- Our SaaS Cloud Platform will provide access to MLR algorithm anytime, anywhere.
Why choose smartMLR?
- Predictive modeling: Multiple linear regression can be used for predictive modeling. By analyzing the relationships between the independent variables and the dependent variable, you can create a model that predicts the value of the dependent variable for new data points.
- Hypothesis testing: Multiple linear regression can be used to test hypotheses about the relationships between the independent variables and the dependent variable. For example, you may want to test whether there is a significant linear relationship between a person’s education level, work experience, and their salary.
- Variable selection: Multiple linear regression can help you to identify which independent variables are most important in explaining the variation in the dependent variable. This can be useful for variable selection and feature engineering in machine learning models.
- Control for confounding variables: Multiple linear regression can be used to control for confounding variables. By including multiple independent variables in the model, you can account for the effects of other variables that may be related to the dependent variable.
- Interpretation: Multiple linear regression provides coefficients for each independent variable, which can help you to interpret the relationships between the variables. The coefficients represent the change in the dependent variable for a one-unit change in the independent variable, holding all other variables constant.
Applications of magicMLR:
Finance
- Portfolio optimization: Multiple linear regression can be used to analyze the relationships between different stocks or other financial instruments, and to identify the optimal mix of investments for a given portfolio.
- Risk analysis: Multiple linear regression can be used to analyze the relationships between different factors and the level of risk associated with a particular investment.
- Credit scoring: Multiple linear regression can be used to analyze the relationships between credit scores and other factors such as income, employment history, and debt levels, to predict the likelihood of default on a loan.
- Asset pricing models: Multiple linear regression can be used to analyze the relationships between various factors such as interest rates, inflation, and stock prices, and to develop asset pricing models that can be used to value financial instruments.
- Financial forecasting: Multiple linear regression can be used to analyze the relationships between various factors and to make predictions about financial outcomes such as stock prices, interest rates, and exchange rates.
- Risk management: Multiple linear regression can be used to analyze the relationships between various factors and to identify potential risks to financial markets or individual companies.
Marketing
- Sales forecasting: Multiple linear regression can be used to forecast future sales based on historical sales data and other variables such as promotional activities, seasonality, and economic indicators.
- Pricing strategy: Multiple linear regression can help marketers determine the optimal price for a product based on factors such as production costs, competitor prices, and consumer demand.
- Marketing mix optimization: Multiple linear regression can be used to analyze the impact of various marketing channels such as advertising, direct mail, and social media on the sales of a product, and optimize the marketing mix accordingly.
- Customer segmentation: Multiple linear regression can be used to identify different segments of customers based on their demographics, buying behavior, and other characteristics, and tailor marketing campaigns to each segment.
- Product development: Multiple linear regression can help marketers understand the factors that drive consumer preference for a product, and identify areas for improvement in product features, design, and packaging.
Healthcare
- Predictive modeling: Multiple linear regression can be used to predict patient outcomes based on a combination of patient characteristics, such as age, gender, comorbidities, and laboratory results.
- Disease risk assessment: Multiple linear regression can help identify factors that increase the risk of developing a particular disease or condition, such as diabetes or heart disease, by analyzing data on patient demographics, lifestyle factors, and clinical measures.
- Resource allocation: Multiple linear regression can be used to identify the factors that contribute to the cost of healthcare services, such as hospitalization or surgery, and help allocate resources more efficiently.
- Quality improvement: Multiple linear regression can be used to identify factors that contribute to patient satisfaction or dissatisfaction with healthcare services, and help improve the quality of care provided.
- Clinical research: Multiple linear regression can be used to analyze data from clinical trials, such as patient characteristics, treatment regimens, and outcomes, to identify factors that influence the effectiveness of treatment.
Social sciences
- Educational research: Multiple linear regression can be used to analyze the impact of various factors such as student demographics, teacher quality, and school resources on academic performance and graduation rates.
- Psychological research: Multiple linear regression can help identify factors that contribute to mental health outcomes, such as depression, anxiety, and stress, by analyzing data on social support, life events, and personality traits.
- Sociological research: Multiple linear regression can be used to analyze the relationship between social factors such as income, education, and occupation and social outcomes such as crime rates and health disparities.
- Political science research: Multiple linear regression can help analyze the factors that influence political attitudes and behaviors, such as party affiliation, ideology, and demographic characteristics.
- Market research: Multiple linear regression can be used to analyze consumer behavior, such as the factors that influence product preference and purchasing decisions.
Manufacturing
- Quality control: Multiple linear regression can be used to identify factors that contribute to defects in manufacturing processes, such as machine settings, material properties, and environmental factors.
- Production planning: Multiple linear regression can be used to predict production output based on a combination of factors such as machine speed, labor hours, and raw material availability.
- Supply chain management: Multiple linear regression can be used to analyze the impact of factors such as supplier performance, inventory levels, and transportation costs on manufacturing performance.
- Maintenance management: Multiple linear regression can help identify factors that contribute to equipment failure and downtime, such as maintenance schedules, environmental conditions, and equipment age.
- Cost analysis: Multiple linear regression can be used to analyze the relationship between manufacturing costs and various factors such as production volume, labor costs, and material costs.
Agriculture
- Quality control: Multiple linear regression can be used to identify factors that contribute to defects in manufacturing processes, such as machine settings, material properties, and environmental factors.
- Production planning: Multiple linear regression can be used to predict production output based on a combination of factors such as machine speed, labor hours, and raw material availability.
- Supply chain management: Multiple linear regression can be used to analyze the impact of factors such as supplier performance, inventory levels, and transportation costs on manufacturing performance.
- Maintenance management: Multiple linear regression can help identify factors that contribute to equipment failure and downtime, such as maintenance schedules, environmental conditions, and equipment age.
- Cost analysis: Multiple linear regression can be used to analyze the relationship between manufacturing costs and various factors such as production volume, labor costs, and material costs.
Environmental sciences
- Crop yield prediction: Multiple linear regression can be used to predict crop yields based on a combination of factors such as soil moisture, temperature, precipitation, and fertilizer application.
- Soil analysis: Multiple linear regression can help identify factors that contribute to soil fertility, such as pH, organic matter content, and nutrient levels.
- Crop management: Multiple linear regression can be used to identify factors that contribute to crop growth and health, such as irrigation, pest control, and planting density.
- Farm management: Multiple linear regression can be used to analyze the impact of factors such as farm size, labor availability, and machinery use on agricultural productivity and profitability.
- Climate change impact analysis: Multiple linear regression can be used to analyze the impact of climate change on crop yields, by analyzing data on temperature, precipitation, and other climate variables.
Business Intelligence
- Sales forecasting: Multiple linear regression can be used to predict future sales based on a combination of factors such as historical sales data, marketing spend, and economic indicators.
- Customer segmentation: Multiple linear regression can help identify factors that contribute to customer behavior, such as purchase frequency and loyalty, by analyzing data on demographics, purchase history, and marketing engagement.
- Pricing analysis: Multiple linear regression can be used to analyze the impact of factors such as cost, competition, and demand on pricing strategies and profitability.
- Marketing effectiveness: Multiple linear regression can help analyze the impact of marketing campaigns and channels on customer acquisition, retention, and revenue generation.
- Risk management: Multiple linear regression can be used to analyze the relationship between various risk factors, such as market volatility, credit risk, and operational risk, and business performance.
Aeronautics and Astronomy
- Aircraft performance: Multiple linear regression can be used to analyze the impact of factors such as airspeed, altitude, temperature, and humidity on aircraft performance, such as speed, range, and fuel efficiency.
- Spacecraft design: Multiple linear regression can be used to analyze the impact of various factors such as engine performance, fuel consumption, and weight on spacecraft design and performance.
- Atmospheric modeling: Multiple linear regression can help identify factors that contribute to atmospheric phenomena, such as temperature variations, wind patterns, and precipitation, by analyzing data from multiple sources.
- Remote sensing: Multiple linear regression can be used to analyze the relationships between satellite data and environmental factors, such as land use, vegetation, and atmospheric composition.
- Stellar properties: Multiple linear regression can help identify factors that contribute to stellar properties, such as luminosity, temperature, and chemical composition, by analyzing data from multiple telescopes and observatories.
Chemical Industry
- Process optimization: Multiple linear regression can be used to identify factors that contribute to production outcomes, such as product yield, quality, and purity, and optimize the process accordingly.
- Quality control: Multiple linear regression can be used to identify factors that contribute to product defects, such as material properties, processing conditions, and environmental factors, and implement appropriate quality control measures.
- Product development: Multiple linear regression can be used to identify factors that contribute to product performance, such as viscosity, melting point, and solubility, and optimize the formulation accordingly.
- Environmental impact analysis: Multiple linear regression can be used to analyze the relationship between production factors, such as energy consumption, water usage, and waste generation, and environmental impact.
- Cost analysis: Multiple linear regression can be used to analyze the relationship between production costs and various factors such as raw material prices, labor costs, and equipment maintenance costs.
Agriculture Sector
- Crop yield prediction: Multiple linear regression can be used to predict crop yield based on factors such as weather conditions, soil properties, irrigation, and fertilization.
- Soil health assessment: Multiple linear regression can be used to analyze the impact of factors such as soil pH, organic matter content, and nutrient levels on crop yield and plant health.
- Pest management: Multiple linear regression can be used to identify factors that contribute to pest infestations, such as weather patterns, plant variety, and farming practices, and implement appropriate pest management strategies.
- Crop breeding: Multiple linear regression can be used to identify factors that contribute to desirable plant traits, such as disease resistance, yield potential, and nutritional value, and optimize breeding programs accordingly.
- Environmental impact analysis: Multiple linear regression can be used to analyze the relationship between agricultural practices, such as tillage, irrigation, and fertilizer use, and environmental impact.
LifeSciences
- Drug discovery: Multiple linear regression can be used to identify factors that contribute to drug efficacy, such as molecular structure, dose, and route of administration, and optimize drug design accordingly.
- Clinical trials: Multiple linear regression can be used to identify factors that contribute to patient outcomes, such as drug efficacy, side effects, and disease progression, and optimize clinical trial design accordingly.
- Disease risk prediction: Multiple linear regression can be used to predict disease risk based on factors such as age, gender, genetics, and lifestyle factors.
- Gene expression analysis: Multiple linear regression can be used to analyze the relationship between gene expression and various factors such as disease status, treatment response, and environmental exposure.
- Medical imaging analysis: Multiple linear regression can be used to analyze the relationship between medical imaging features and various factors such as disease progression, treatment response, and patient outcomes.
What does smartMLR bring for you ?
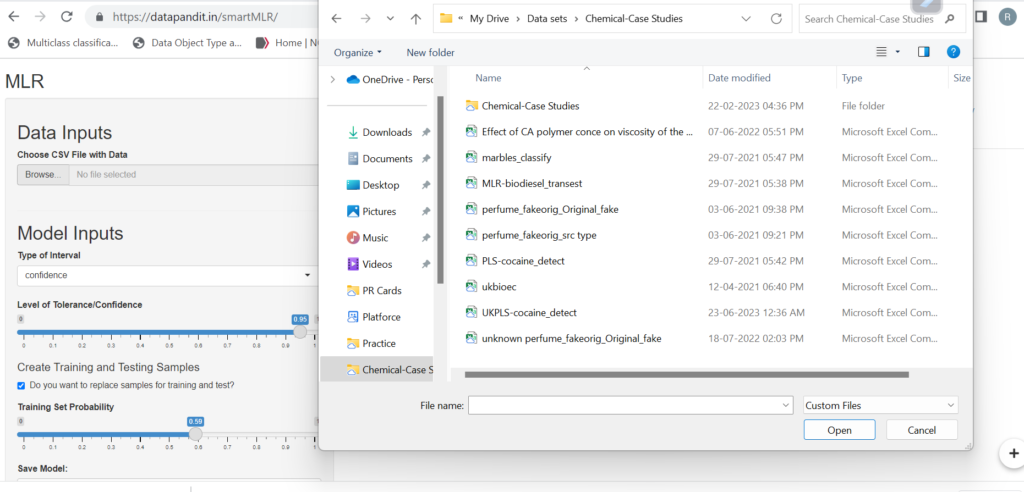
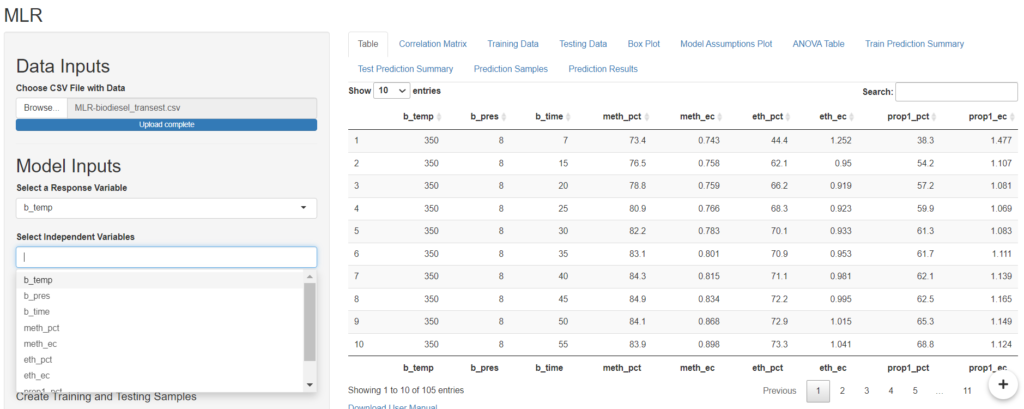
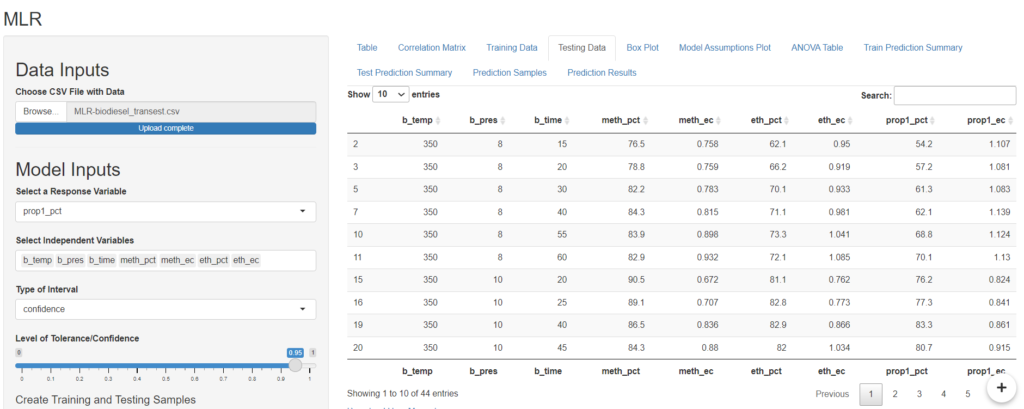
- “Browse” feature allows the user to upload the dataset for data analysis.
- From “Model Input”s Section user can choose “Response Variable” and “Independent Variable” for input. “tolerance and confidence”are two related concepts that help to evaluate the reliability of the regression model. You can select them from slider.
- User can select the ratio of testing and training dataset from “Training Set Probability” slider .

- “Correlation Matrix” feature shows user the Graphical visualization of the degree of association between the two or more independent variables and the dependent variable.
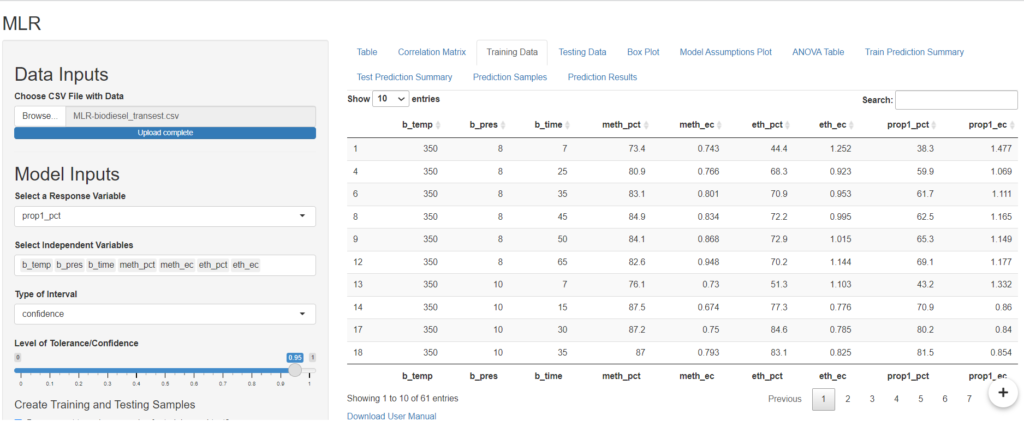
- “Training Dataset ” shows the data points of the data that are used for training the model.
- “Testing Dataset ” shows the datapoints of the data that are used for testing the model.
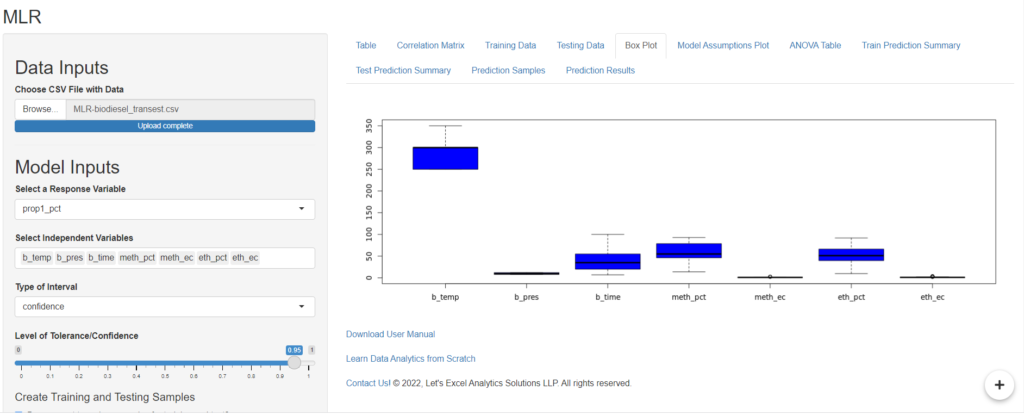
- smartMLR provides the users “Box Plot” view which is a graphical representation of the independent variables.
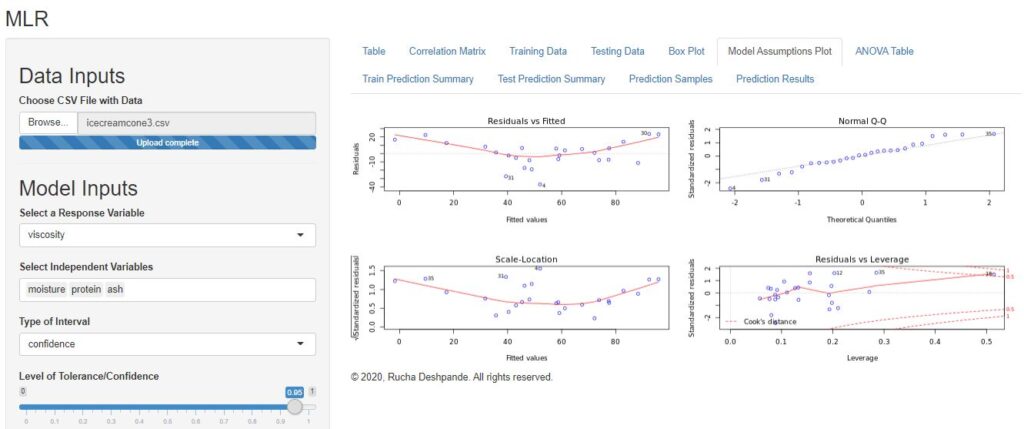
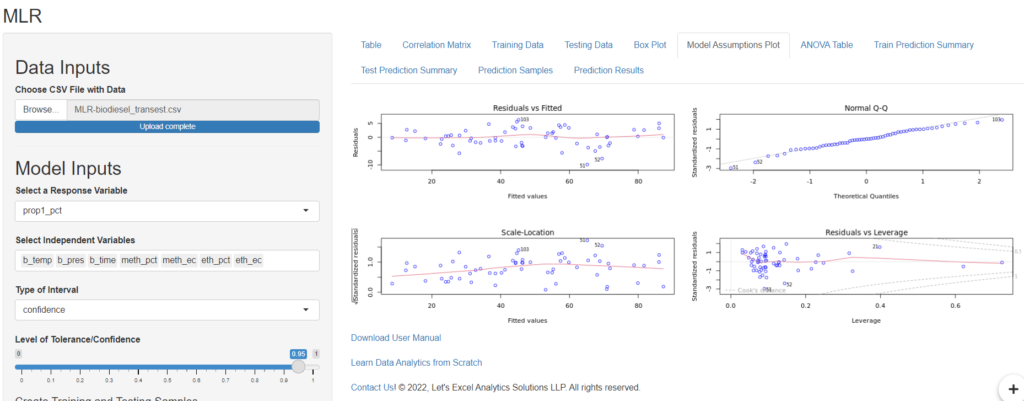
- “Model Assumption Plot” assesses whether the assumptions of the regression model are met. There are several assumptions such as Residual vs Fitted , Normal Q-Q, Scale-Location, and Residuals Vs. Leverage.
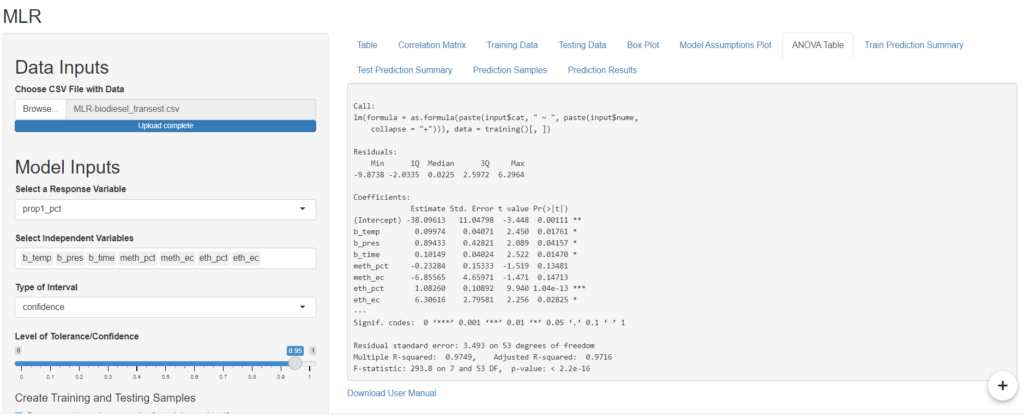
- ÄNOVA TAble” feature summarises the results of the regression model. ANOVA table typically includes residual, coefficients , errors , degree of freedom, square mean etc.
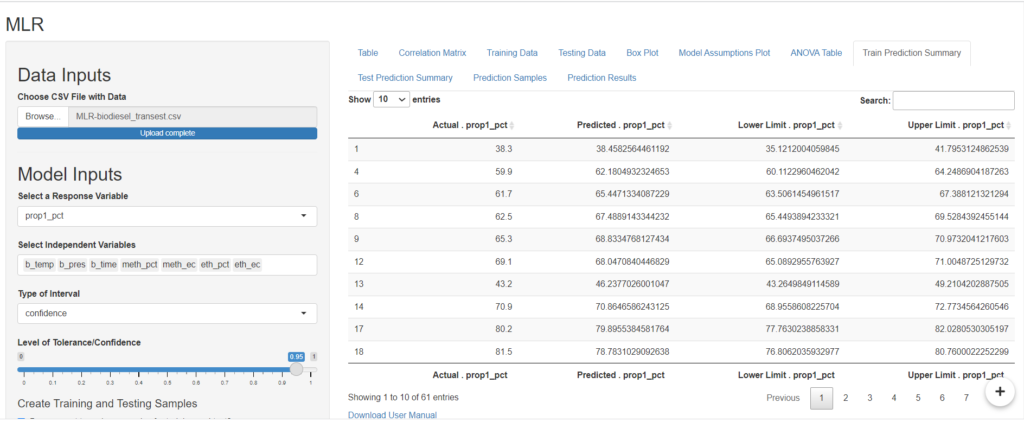
- “Train Prediction Summary” provides user a tabular view of the predicted data points from the train dataset.
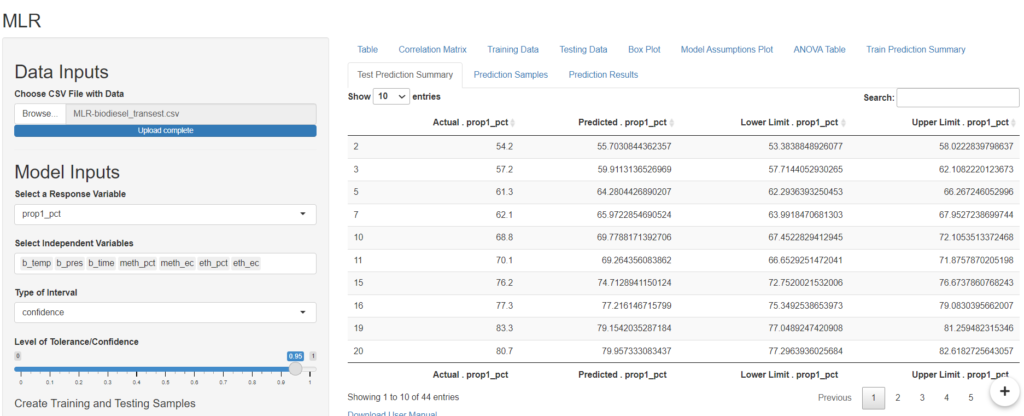
- “Test Prediction Summary” provides the user with a tabular view of the predicted data points from the test dataset.
- Additionally, users can upload unknown samples and make predictions using the previously built model. For step-by-step guidance on how to use smartMLR for linear regression and multilinear regression read this blog article. To know more about statistical assumptions before building linear regression or multiple regression models, read this article.
Interested in exploring data analytics case studies using smartMLR? Download our free data analytics case studies here Or purchase our Data Analytics Case Studies e-Book on Amazon.