Introduction:
- In PCR, the independent variables also known as predictors or features are first transformed using PCA to obtain a set of orthogonal principal components (PCs) that capture most of the variation in the data. Then, the regression model is fitted using the transformed principal components as predictors, instead of the original variables.
- Our SaaS Cloud PLatform will provide a web-based solution which can serve as an alternative to Multiple Linear Regression and Partial Least Square Regression.
- Our SaaS Cloud Platform will be provided to the user for data analytics anytime,anywhere.
Why choose quickPCR?
- Improved predictive performance: PCR can improve the accuracy and stability of regression models, especially when dealing with high-dimensional datasets or multicollinearity among the independent variables. By reducing the dimensionality of the data and capturing the most important sources of variation in the predictors, PCR can help avoid overfitting and improve the generalization performance of the model.
- Reduced complexity: PCR simplifies the model by reducing the number of predictors while still explaining most of the variation in the data. This can make the model easier to interpret, and it can also reduce the computational complexity of the regression analysis.
- Multicollinearity handling: PCR can handle multicollinearity among the independent variables, which can lead to instability and inflated standard errors in traditional regression models. By transforming the predictors into uncorrelated principal components, PCR can eliminate or reduce the impact of multicollinearity on the regression coefficients.
- Outlier detection: PCR can identify outliers and influential observations that may affect the regression results. This is because outliers may have a strong influence on one or a few principal components, making them more visible in the transformed space.
- Feature selection: PCR can help identify the most important predictors in the data by selecting the principal components that explain the most variation. This can be useful for feature selection and data reduction in machine learning and data mining applications.
- Dimensionality reduction: When dealing with high-dimensional datasets with many predictors, it can be challenging to fit a regression model that captures all the important sources of variation in the data. PCR can help reduce the dimensionality of the data by selecting a smaller set of principal components that capture most of the variation. This can simplify the model and reduce the risk of overfitting.
Applications of LDA:
Finance
- Risk management: PCR can be used to identify the most important factors that contribute to market risk, such as interest rates, exchange rates, and stock prices. By building a predictive model using PCR, financial institutions can better manage their exposure to market risk and optimize their risk management strategies.
- Portfolio optimization: PCR can help investors and asset managers to build more efficient portfolios by identifying the most important factors that drive asset returns. By incorporating the principal components into their portfolio optimization models, investors can achieve better diversification and improve their risk-adjusted returns.
- Asset pricing: PCR can be used to identify the key factors that affect the prices of financial assets, such as stocks, bonds, and commodities. By building a pricing model using PCR, investors can better understand the factors that drive asset prices and make more informed investment decisions.
- Credit risk assessment: PCR can be used to analyze credit risk and predict the likelihood of default. By identifying the most important factors that contribute to credit risk, financial institutions can improve their credit scoring models and better manage their exposure to credit risk.
- Market forecasting: PCR can be used to build predictive models for financial markets, such as stock prices or exchange rates. By identifying the most important factors that drive market movements, investors can make more informed investment decisions and improve their investment performance.
Manufacturing
- Quality control: PCR can be used to identify the key factors that contribute to product quality and performance, such as temperature, humidity, and pressure. By building a predictive model using PCR, manufacturers can better monitor and control their production processes to improve product quality and reduce defects.
- Process optimization: PCR can be used to identify the most important factors that affect production efficiency, such as cycle time, machine speed, and material usage. By building a predictive model using PCR, manufacturers can optimize their production processes and reduce costs while maintaining product quality.
- Fault detection: PCR can be used to identify the most important factors that contribute to equipment failures and product defects. By building a predictive model using PCR, manufacturers can detect faults early and take corrective action to minimize downtime and reduce waste.
- Supply chain management: PCR can be used to analyze supply chain data and identify the most important factors that affect delivery times, inventory levels, and shipping costs. By building a predictive model using PCR, manufacturers can optimize their supply chain operations and reduce costs while improving customer satisfaction.
- Energy management: PCR can be used to identify the most important factors that affect energy usage, such as temperature, humidity, and lighting. By building a predictive model using PCR, manufacturers can optimize their energy usage and reduce costs while minimizing their environmental impact.
Biotechnology
- Gene expression analysis: PCR can be used to analyze gene expression data, which involves identifying genes that are differentially expressed between two or more conditions. PCR can be used to identify the most important genes that contribute to the differences between the conditions.
- Proteomics: PCR can be used to analyze protein expression data. It can identify the most important proteins that contribute to the differences between two or more conditions. This can help in the identification of potential drug targets or biomarkers.
- Metabolomics: PCR can be used to analyze metabolite data. It can identify the most important metabolites that contribute to the differences between two or more conditions. This can help in the identification of potential drug targets or biomarkers.
- Drug discovery: PCR can be used to identify the most important features that contribute to the efficacy of a drug. This can help in the identification of potential drug targets or in the optimization of drug efficacy.
- Disease diagnosis: PCR can be used to identify the most important features that contribute to the diagnosis of a disease. This can help in the development of diagnostic tests that are more accurate and reliable.
Marketing
- Customer segmentation: PCR can be used to segment customers based on their characteristics, such as demographics, behavior, and preferences. By identifying the most important features that distinguish different customer segments, businesses can tailor their marketing strategies to better meet the needs of each segment.
- Predictive modeling: PCR can be used to build predictive models that forecast customer behavior, such as purchase intent or loyalty. By identifying the most important factors that influence customer behavior, businesses can make better decisions about marketing tactics, product development, and customer service.
- Product development: PCR can be used to identify the most important features that contribute to customer satisfaction and loyalty. This can help businesses to develop products and services that better meet the needs of their customers.
- Market research: PCR can be used to analyze market research data, such as surveys and focus groups. By identifying the most important factors that influence customer attitudes and behaviors, businesses can gain insights into market trends and customer preferences.
- Pricing optimization: PCR can be used to identify the most important factors that influence price sensitivity and willingness to pay. This can help businesses to optimize their pricing strategies to maximize revenue and profitability.
Environmental science
- Environmental monitoring: PCR can be used to analyze environmental data, such as air and water quality data. By identifying the most important factors that contribute to environmental degradation, scientists can develop targeted strategies to mitigate pollution and improve environmental quality.
- Climate modeling: PCR can be used to analyze climate data, such as temperature and precipitation data. By identifying the most important factors that influence climate patterns, scientists can develop more accurate and reliable climate models that can be used to predict future climate conditions.
- Ecological modeling: PCR can be used to analyze ecological data, such as species abundance and diversity data. By identifying the most important factors that influence ecosystem dynamics, scientists can develop more accurate and reliable models that can be used to predict the effects of environmental change on ecosystems.
- Soil science: PCR can be used to analyze soil data, such as nutrient content and microbial activity. By identifying the most important factors that contribute to soil health and productivity, scientists can develop targeted strategies to improve soil quality and fertility.
- Environmental risk assessment: PCR can be used to analyze data from environmental risk assessments, such as toxicity data and exposure data. By identifying the most important factors that contribute to environmental risks, scientists can develop more effective risk management strategies to protect human health and the environment.
Business Intelligence
- Predictive modeling: PCR can be used to build predictive models that forecast future business performance, such as sales, revenue, and customer satisfaction. By identifying the most important factors that influence business outcomes, businesses can make better decisions about strategy and resource allocation.
- Customer analytics: PCR can be used to analyze customer data, such as demographics, behavior, and preferences. By identifying the most important factors that influence customer behavior, businesses can develop targeted marketing strategies and improve customer engagement.
- Fraud detection: PCR can be used to identify patterns of fraudulent behavior, such as credit card fraud or insurance fraud. By identifying the most important factors that distinguish fraudulent transactions from legitimate transactions, businesses can develop more effective fraud detection and prevention strategies.
- Supply chain management: PCR can be used to analyze supply chain data, such as inventory levels and shipping times. By identifying the most important factors that influence supply chain performance, businesses can optimize their supply chain operations and improve efficiency.
- Risk management: PCR can be used to analyze data from risk assessments, such as credit risk or operational risk. By identifying the most important factors that contribute to risk, businesses can develop more effective risk management strategies to protect against potential losses.
Aeronautics and Astronomy
- Signal processing: PCR can be used to analyze signals from sensors, such as radar or sonar signals. By identifying the most important factors that distinguish signals from different sources, scientists can develop more accurate and reliable signal processing algorithms.
- Image processing: PCR can be used to analyze images from telescopes or satellites. By identifying the most important factors that contribute to image quality, scientists can develop more effective image processing techniques to improve resolution and reduce noise.
- Data reduction: PCR can be used to reduce the dimensionality of large datasets, such as astronomical survey data. By identifying the most important factors that contribute to variability in the data, scientists can reduce the size of the dataset without losing important information.
- Atmospheric modeling: PCR can be used to analyze atmospheric data, such as temperature and pressure data. By identifying the most important factors that influence atmospheric conditions, scientists can develop more accurate and reliable atmospheric models that can be used to predict weather and climate patterns.
- Aircraft design: PCR can be used to analyze data from wind tunnel experiments, such as aerodynamic data. By identifying the most important factors that contribute to aircraft performance, engineers can design more efficient and effective aircraft that meet specific performance requirements.
Chemical Industry
- Process optimization: PCR can be used to optimize chemical processes, such as reaction kinetics or distillation processes. By identifying the most important factors that influence process performance, engineers can optimize the process parameters to improve yield and reduce costs.
- Quality control: PCR can be used to analyze data from quality control tests, such as chemical analysis or physical properties. By identifying the most important factors that contribute to product quality, engineers can develop more effective quality control strategies and ensure consistent product quality.
- Product development: PCR can be used to analyze data from product development experiments, such as formulation optimization or material selection. By identifying the most important factors that contribute to product performance, engineers can design products that meet specific performance requirements.
- Environmental monitoring: PCR can be used to analyze environmental data from chemical plants, such as air emissions or wastewater quality. By identifying the most important factors that contribute to environmental impacts, engineers can develop targeted strategies to reduce pollution and improve environmental performance.
- Predictive maintenance: PCR can be used to analyze data from equipment sensors, such as temperature or pressure sensors. By identifying the most important factors that contribute to equipment failure, engineers can develop predictive maintenance strategies to prevent downtime and reduce maintenance costs.
Agriculture Sector
- Crop yield prediction: PCR can be used to predict crop yields based on environmental factors, such as temperature, precipitation, and soil nutrients. By identifying the most important factors that influence crop yields, farmers can optimize their crop management practices to improve yields and reduce costs.
- Soil analysis: PCR can be used to analyze soil data, such as nutrient levels and pH. By identifying the most important factors that influence soil fertility and health, farmers can develop targeted fertilization and soil management strategies to improve crop yields.
- Pest management: PCR can be used to analyze data on pest populations and environmental factors, such as temperature and humidity. By identifying the most important factors that contribute to pest outbreaks, farmers can develop more effective pest management strategies to reduce crop losses and improve yields.
- Climate adaptation: PCR can be used to analyze data on climate variability and crop performance. By identifying the most important factors that influence crop resilience to climate variability, farmers can develop more effective adaptation strategies to cope with changing climate conditions.
- Precision agriculture: PCR can be used to analyze data from precision agriculture technologies, such as satellite imagery and drone data. By identifying the most important factors that contribute to crop performance, farmers can develop more precise and efficient crop management strategies to improve yields and reduce costs.
LifeSciences
- Gene expression analysis: PCR can be used to analyze gene expression data from microarrays or RNA sequencing experiments. By identifying the most important factors that contribute to gene expression variability, scientists can develop more accurate and reliable gene expression models to better understand disease mechanisms and drug responses.
- Biomarker discovery: PCR can be used to identify biomarkers for disease diagnosis and treatment. By identifying the most important factors that distinguish disease samples from healthy samples, scientists can develop biomarker panels that can be used for early disease detection and personalized medicine.
- Drug discovery: PCR can be used to analyze data from high-throughput drug screening experiments. By identifying the most important factors that influence drug efficacy and toxicity, scientists can develop more effective drug screening strategies and identify potential drug targets.
- Proteomics: PCR can be used to analyze protein expression data from mass spectrometry experiments. By identifying the most important factors that contribute to protein expression variability, scientists can develop more accurate and reliable protein expression models to better understand disease mechanisms and drug responses.
- Systems biology: PCR can be used to integrate data from multiple omics platforms, such as genomics, proteomics, and metabolomics. By identifying the most important factors that contribute to disease mechanisms and drug responses across multiple omics levels, scientists can develop more comprehensive and holistic models of disease and drug action.
What does quickPCR bring for you ?
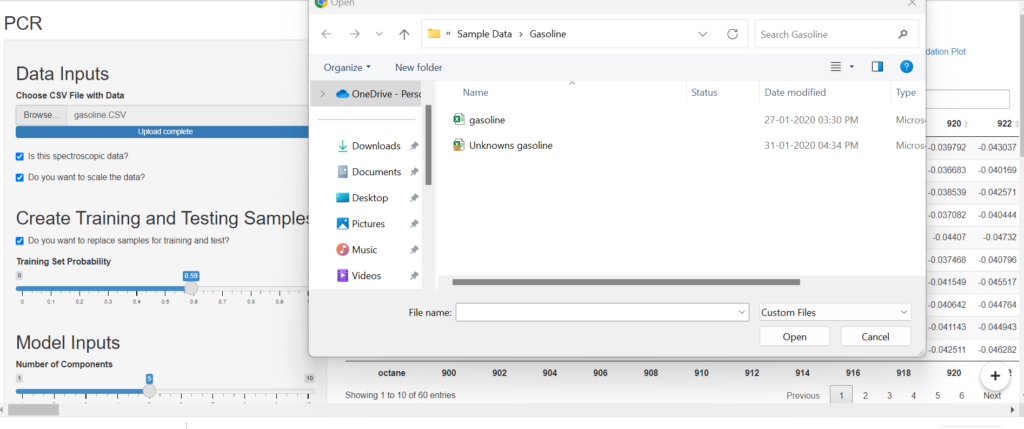
- quickPCR allows users to upload the dataset from a local device for analysis.
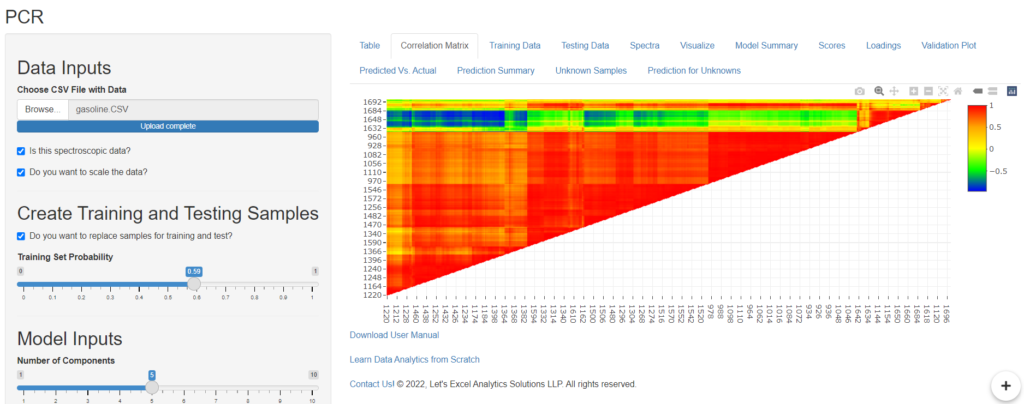
- quickPCR provides users with a “Correlation matrix” feature to predict the relationship between variables from the dataset. It provides a beautiful chart view for better correlation of the data points. Here the 1 (Red) indicates high correlation and -1(Blue) indicates low correlation.
- quickPCR also provides us with a “Training Data” feature which shows the training dataset and the ratio of training dataset which is adjust with the help of “Training Set Probability slider” .
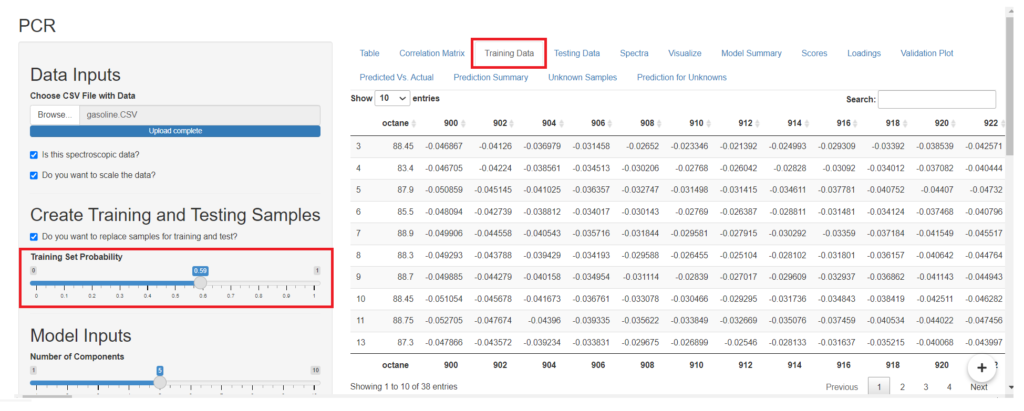
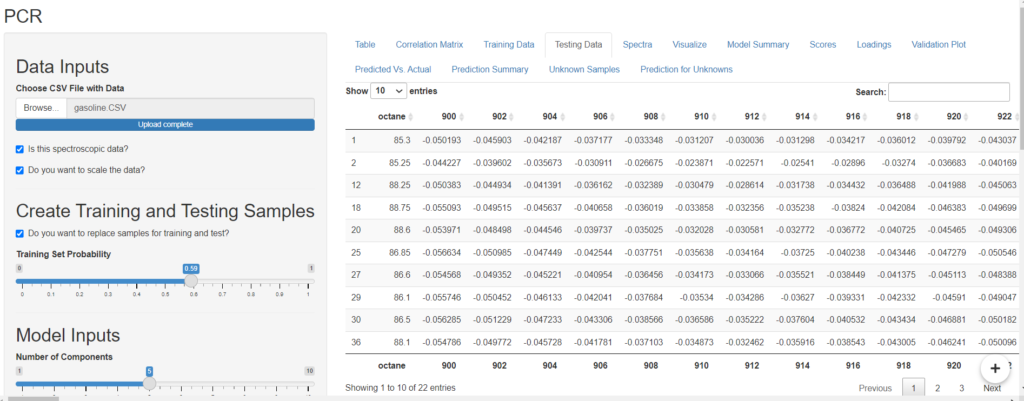
- The “Testing Data” option will show you the ratio of the dataset which is in the testing phrase. The testing data can be increased by sliding the slider on “Training Set Probability”.
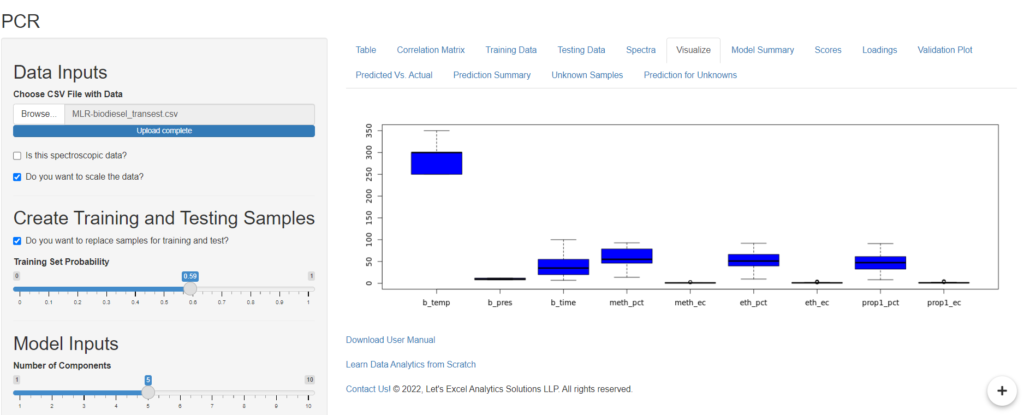
- quickPCR allows the “Visualize” feature which allows the user to get a boxplot view if the dataset is non-spectroscopic.
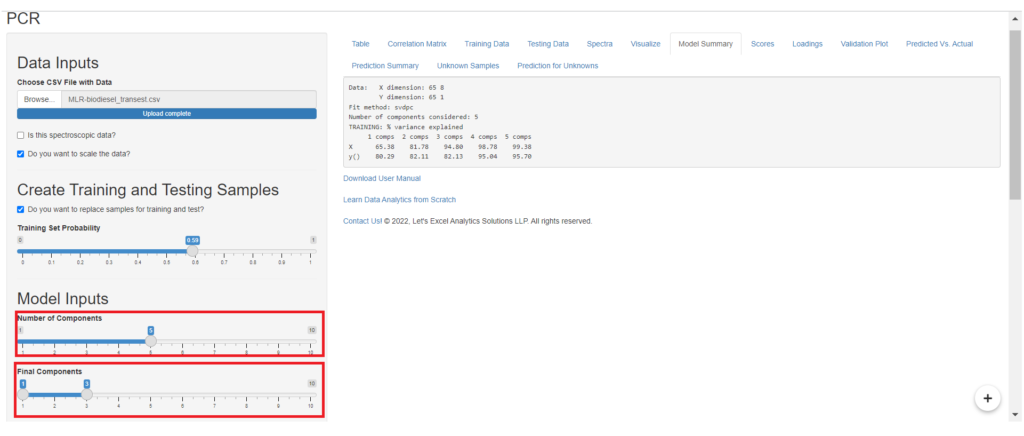
- The “Model Summary” feature allows users to get model summary of the dataset and the calculations of the algorithm. The user can also set the number of components he wants from the “Number of Component” slider and similarly the final components from the “Final Component” slider.
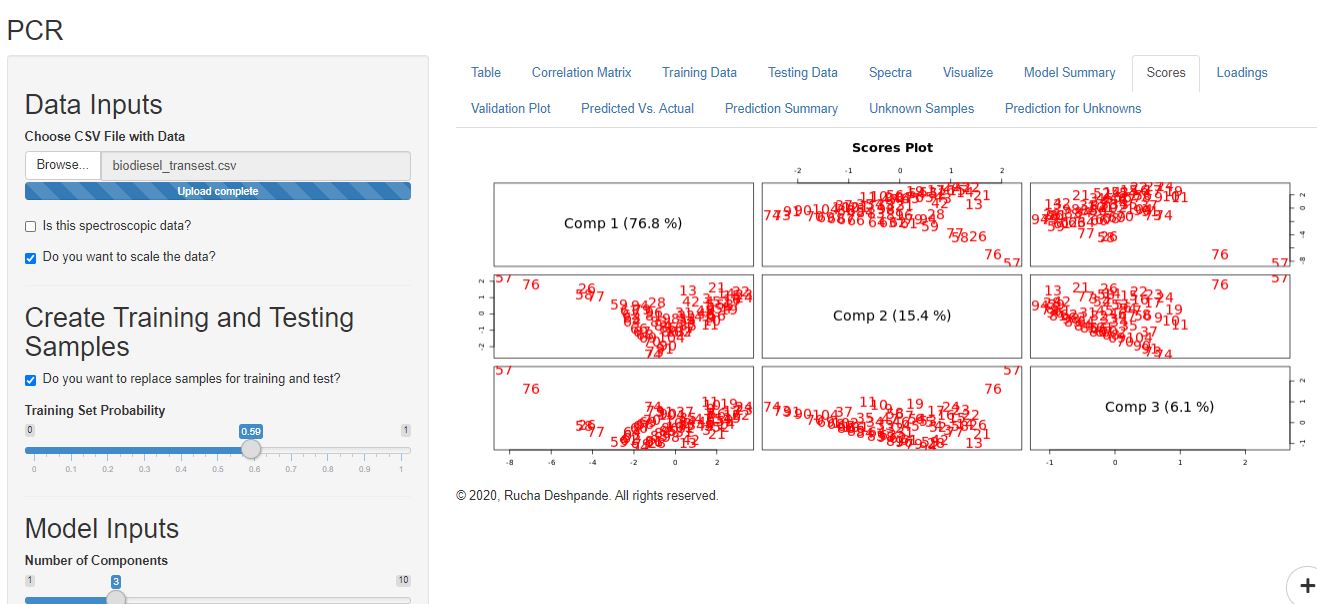
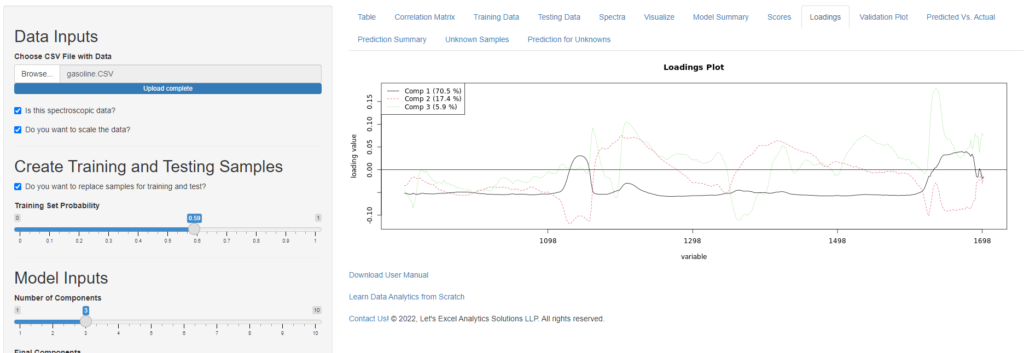
- The “Loading” Option will provide the user graphical 2D view of the variable with respect to loading value. In the case of spectroscopy data the loading view will look like this:
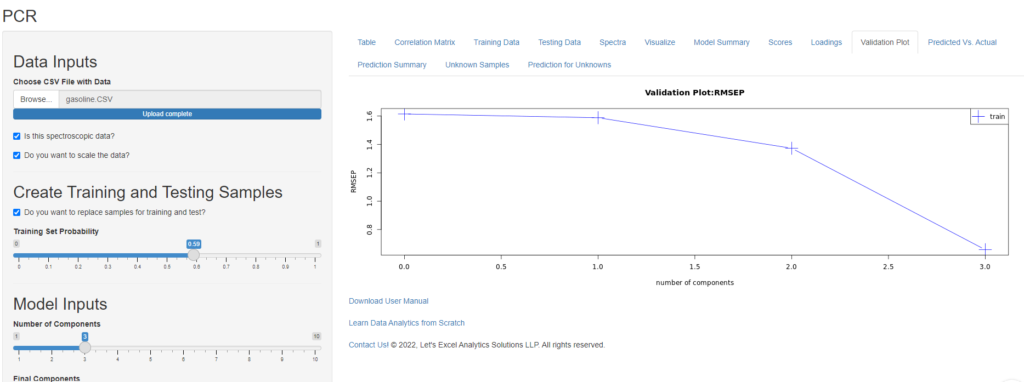
- The “Validation Plot” option plots the graphical view of the model evaluation parameters such as RMSEP, MSEP, and R square by selecting the appropriate option in the “Validation Plot Type” option provided in the sidebar menu.
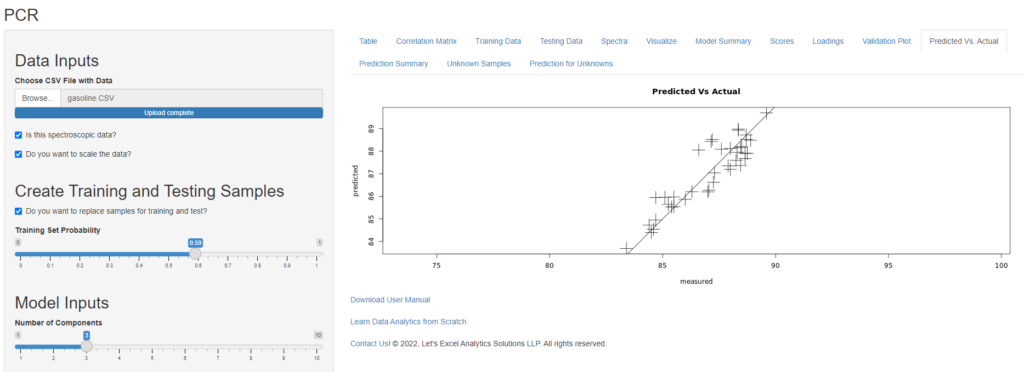
- quickPCR provides a user “Predicted vs Actual” feature that allows a graphical view to check if the predicted value of the dependent variable in agreement with actual values.
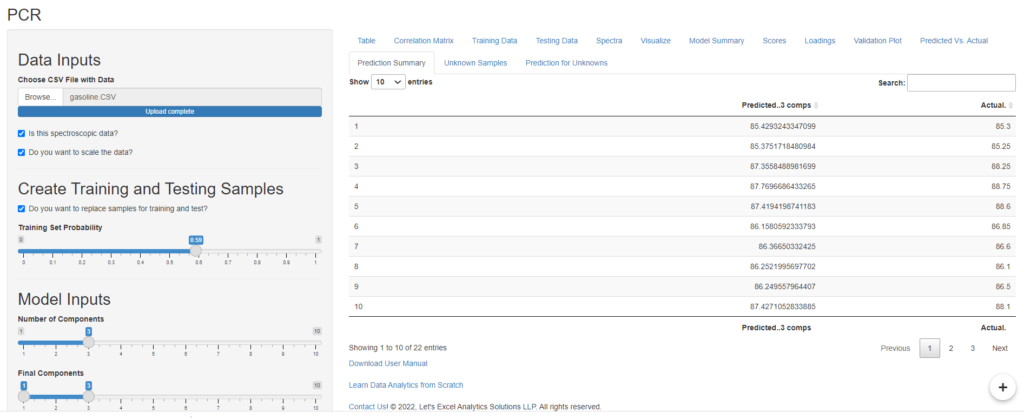
- “Prediction Summary” shows the tabular view of predicted data points from the Testing Data.
- More advanced options for predicting unknown data are also available in the software. Feel free to contact us to know more options.
Interested in exploring data analytics case studies using quickPCR? Download our free data analytics case studies here Or purchase our Data Analytics Case Studies e-Book on Amazon.