Introduction:
- Partial Least Squares (PLS) is a statistical technique used for regression modeling in which the quantitative relationship between the predictor variables known as independent variables and the response variable known as the dependent variable is modeled in a way that accounts for the correlation between the predictor variables.
- Our cloud SaaS Platform will provide you a web-based solution useful if data has a high degree of multicollinearity within the factors and you need quantitative predictions from the model.
- A SaaS Cloud Platform will be provided to the user for data analytics anytime, anywhere.
Why choose the easyPLS Algorithm?
- Multicollinearity handling: PLS is able to handle multicollinearity, which is the high correlation between predictor variables. This is because PLS reduces the dimensionality of the predictor variables into a smaller set of uncorrelated latent variables or components, which capture the maximum variation in the predictor variables while also explaining the maximum variation in the response variable.
- Improved predictive accuracy: PLS can improve predictive accuracy compared to other linear regression techniques, such as ordinary least squares (OLS), when many predictor variables are highly correlated with each other and the response variable. This is because PLS models the relationship between the predictor variables and the response variable in a way that maximizes the covariance between them.
- Nonlinear modeling: PLS can be used for nonlinear modeling, where the relationship between the predictor variables and the response variable is nonlinear. This is achieved by transforming the predictor variables into a higher-dimensional space, where the relationship between the predictor variables and the response variable is linear.
- Variable selection: PLS can be used for variable selection, where only the most relevant predictor variables are selected for the model. This can reduce the complexity of the model and improve the interpretability of the results.
- Robustness: PLS is a robust technique that is less sensitive to outliers and missing data compared to other regression techniques. This is because PLS uses a soft modelling approach that accounts for the noise in the data.
- Interpretable results: PLS produces results that are easy to interpret and explain. This is because PLS reduces the dimensionality of the predictor variables into a smaller set of uncorrelated latent variables or components, which can be visualized and analyzed. Additionally, PLS can be used for variable selection, which can further improve the interpretability of the results.
Applications of PLS
1. Life Sciences
- Metabolomics: PLS is widely used in metabolomics to analyze large data sets of metabolite concentrations. PLS can be used to identify metabolic pathways and biomarkers that are related to different biological states, such as disease states, drug treatments, or environmental conditions.
- Proteomics: PLS can also be used in proteomics to analyze large data sets of protein concentrations. PLS can be used to identify protein-protein interactions, protein pathways, and biomarkers that are related to different biological states.
- Genomics: PLS can be used in genomics to analyze large data sets of gene expression data. PLS can be used to identify genes that are related to different biological states, such as disease states, drug treatments, or environmental conditions.
- Drug discovery: PLS can be used in drug discovery to identify drug targets and predict the efficacy of potential drug candidates. PLS can be used to analyze large data sets of chemical compounds and their biological activity, and to identify chemical structures that are associated with specific biological activities.
- Food science: PLS can be used in food science to analyze large data sets of sensory data and to identify sensory attributes that are related to different food products. PLS can be used to develop predictive models of sensory properties based on the chemical composition of food products.
2. Food & Beverages
- Sensory analysis: PLS is widely used in sensory analysis to analyze large data sets of sensory data and to identify sensory attributes that are related to different food and beverage products. PLS can be used to develop predictive models of sensory properties based on the chemical composition of food and beverage products.
- Quality control: PLS can be used in quality control to analyze large data sets of chemical and physical properties of food and beverage products. PLS can be used to identify factors that affect the quality of food and beverage products, such as processing conditions, storage conditions, and ingredient composition.
- Process optimization: PLS can be used in process optimization to analyze large data sets of process variables and to identify factors that affect the quality and efficiency of food and beverage production processes. PLS can be used to develop predictive models of process variables based on input parameters and environmental conditions.
- Flavour and aroma analysis: PLS can be used in flavour and aroma analysis to analyze large data sets of chemical compounds and their sensory properties. PLS can be used to identify flavour and aroma compounds that are associated with specific food and beverage products, and to develop predictive models of flavour and aroma based on chemical composition.
- Product development: PLS can be used in product development to analyze large data sets of consumer data and to identify factors that influence consumer preferences for food and beverage products. PLS can be used to develop predictive models of consumer preferences based on sensory properties, marketing variables, and demographic variables.
3. Agriculture Sector
- Soil analysis: PLS is widely used in soil analysis to analyze large data sets of soil properties and to identify factors that affect soil quality and plant growth. PLS can be used to develop predictive models of soil properties based on environmental factors, such as weather conditions and soil management practices.
- Crop analysis: PLS can be used in crop analysis to analyze large data sets of crop growth and yield data. PLS can be used to identify factors that affect crop growth and yield, such as soil properties, weather conditions, and management practices.
- Livestock analysis: PLS can be used in livestock analysis to analyze large data sets of animal growth and performance data. PLS can be used to identify factors that affect animal growth and performance, such as feed quality, environmental conditions, and management practices.
- Plant breeding: PLS can be used in plant breeding to analyze large data sets of genetic and phenotypic data. PLS can be used to identify factors that affect plant traits, such as yield, disease resistance, and quality.
- Precision agriculture: PLS can be used in precision agriculture to analyze large data sets of environmental and crop data. PLS can be used to develop predictive models of crop growth and yield based on environmental and management factors, and to optimize crop management practices.
4. Aeronautics and Astronomy
- Aircraft design: PLS can be used in aircraft design to analyze large data sets of aerodynamic and structural properties of aircraft. PLS can be used to identify factors that affect aircraft performance, such as lift, drag, and stability, and to develop predictive models of aircraft performance based on design variables.
- Flight data analysis: PLS can be used in flight data analysis to analyze large data sets of flight data, such as sensor data and flight control data. PLS can be used to identify factors that affect flight performance, such as wind conditions and pilot inputs, and to develop predictive models of flight performance based on flight data.
- Remote sensing: PLS can be used in remote sensing to analyze large data sets of spectral and spatial data from remote sensing platforms, such as satellites and aircraft. PLS can be used to identify factors that affect remote sensing data, such as atmospheric conditions and land cover, and to develop predictive models of remote sensing data based on environmental variables.
- Astronomy data analysis: PLS can be used in astronomy data analysis to analyze large data sets of astronomical data, such as spectra and images. PLS can be used to identify factors that affect astronomical data, such as atmospheric conditions and telescope performance, and to develop predictive models of astronomical data based on environmental variables.
- Spacecraft design: PLS can be used in spacecraft design to analyze large data sets of spacecraft properties, such as structural and thermal properties. PLS can be used to identify factors that affect spacecraft performance, such as mass and power requirements, and to develop predictive models of spacecraft performance based on design variables.
5. Chemical Sector
- Chemical process modelling: PLS can be used in chemical process modelling to analyze large data sets of chemical process variables, such as temperature, pressure, and flow rate. PLS can be used to identify factors that affect chemical process performance, such as reaction kinetics and catalyst activity, and to develop predictive models of chemical process performance based on process variables.
- Quality control: PLS can be used in quality control to analyze large data sets of chemical product properties, such as purity and composition. PLS can be used to identify factors that affect product quality, such as raw material quality and process conditions, and to develop predictive models of product quality based on product properties.
- Spectroscopic analysis: PLS can be used in spectroscopic analysis to analyze large data sets of spectral data, such as infrared and Raman spectra. PLS can be used to identify factors that affect spectral data, such as sample composition and measurement conditions, and to develop predictive models of sample properties based on spectral data.
- Drug discovery: PLS can be used in drug discovery to analyze large data sets of chemical properties of potential drug candidates, such as molecular structure and pharmacokinetic properties. PLS can be used to identify factors that affect drug properties, such as solubility and bioavailability, and to develop predictive models of drug properties based on chemical properties.
- Material science: PLS can be used in material science to analyze large data sets of material properties, such as mechanical strength and thermal conductivity. PLS can be used to identify factors that affect material properties, such as composition and processing conditions, and to develop predictive models of material properties based on material properties.
6. Business Intelligence
PLS is a versatile technique that can be used in many different applications in Business Intelligence. It can be used to model the relationship between complex data sets and business performance, identify the most important predictors of business performance, and optimize business resources.
- Customer segmentation: PLS can be used for customer segmentation, which is the process of dividing customers into groups based on their common characteristics. PLS can be used to identify the most important predictors of customer behaviour and segment customers based on their needs, preferences, and behaviour.
- Marketing analytics: PLS can be used for marketing analytics, where it is used to model the relationship between marketing campaigns and customer behaviour. PLS can be used to identify the most effective marketing campaigns and optimize the allocation of marketing resources.
- Financial modelling: PLS can be used for financial modelling, where it is used to model the relationship between financial variables and business performance. PLS can be used to identify the most important financial variables that drive business performance and optimize financial resources.
- Supply chain optimization: PLS can be used for supply chain optimization, where it is used to model the relationship between supply chain variables and business performance. PLS can be used to identify the most important supply chain variables that affect business performance and optimize the supply chain resources.
- Fraud detection: PLS can be used for fraud detection, where it is used to model the relationship between fraudulent activities and business performance. PLS can be used to identify the most important variables that are indicative of fraud and detect fraudulent activities.
- Customer satisfaction analysis: PLS can be used for customer satisfaction analysis, where it is used to model the relationship between customer satisfaction and business performance. PLS can be used to identify the most important factors that contribute to customer satisfaction and optimize the customer experience.
7. Environmental Science
- Air quality modelling: PLS can be used to develop predictive models of air quality based on meteorological and pollutant data. PLS can identify the most significant factors affecting air quality and help in developing strategies to reduce air pollution.
- Water quality analysis: PLS can be used to analyze large data sets of water quality parameters, such as pH, temperature, and dissolved oxygen. PLS can identify the most significant factors affecting water quality and help in developing strategies to improve water quality.
- Soil quality analysis: PLS can be used to analyze large data sets of soil quality parameters, such as pH, organic matter content, and nutrient levels. PLS can identify the most significant factors affecting soil quality and help in developing strategies to improve soil quality.
- Environmental pollution modelling: PLS can be used to develop predictive models of environmental pollution based on a variety of environmental parameters, such as air quality, water quality, and soil quality. PLS can identify the most significant factors affecting environmental pollution and help in developing strategies to reduce pollution.
- Ecological modelling: PLS can be used to develop predictive models of ecological systems, such as wildlife populations, based on environmental parameters. PLS can identify the most significant factors affecting ecological systems and help in developing strategies to protect and conserve ecosystems.
8. Finance
- Portfolio optimization: PLS can be used to develop predictive models for asset returns and portfolio volatility based on a variety of financial variables, such as stock prices, interest rates, and exchange rates. PLS can identify the most significant factors affecting portfolio performance and help in developing optimal investment strategies.
- Risk management: PLS can be used to develop predictive models for financial risk based on a variety of financial variables, such as market volatility, credit ratings, and economic indicators. PLS can identify the most significant factors affecting financial risk and help in developing risk management strategies.
- Credit scoring: PLS can be used to develop predictive models for credit scoring based on a variety of financial and non-financial variables, such as credit history, income, and employment status. PLS can identify the most significant factors affecting creditworthiness and help in making informed credit decisions.
- Fraud detection: PLS can be used to develop predictive models for fraud detection based on a variety of financial variables, such as transaction history, account activity, and customer behaviour. PLS can identify the most significant factors associated with fraudulent activities and help in detecting and preventing fraud.
- Financial forecasting: PLS can be used to develop predictive models for financial forecasting based on a variety of financial variables, such as GDP growth, interest rates, and inflation rates. PLS can identify the most significant factors affecting financial trends and help in making informed financial decisions.
What does easyPLS bring for you ?
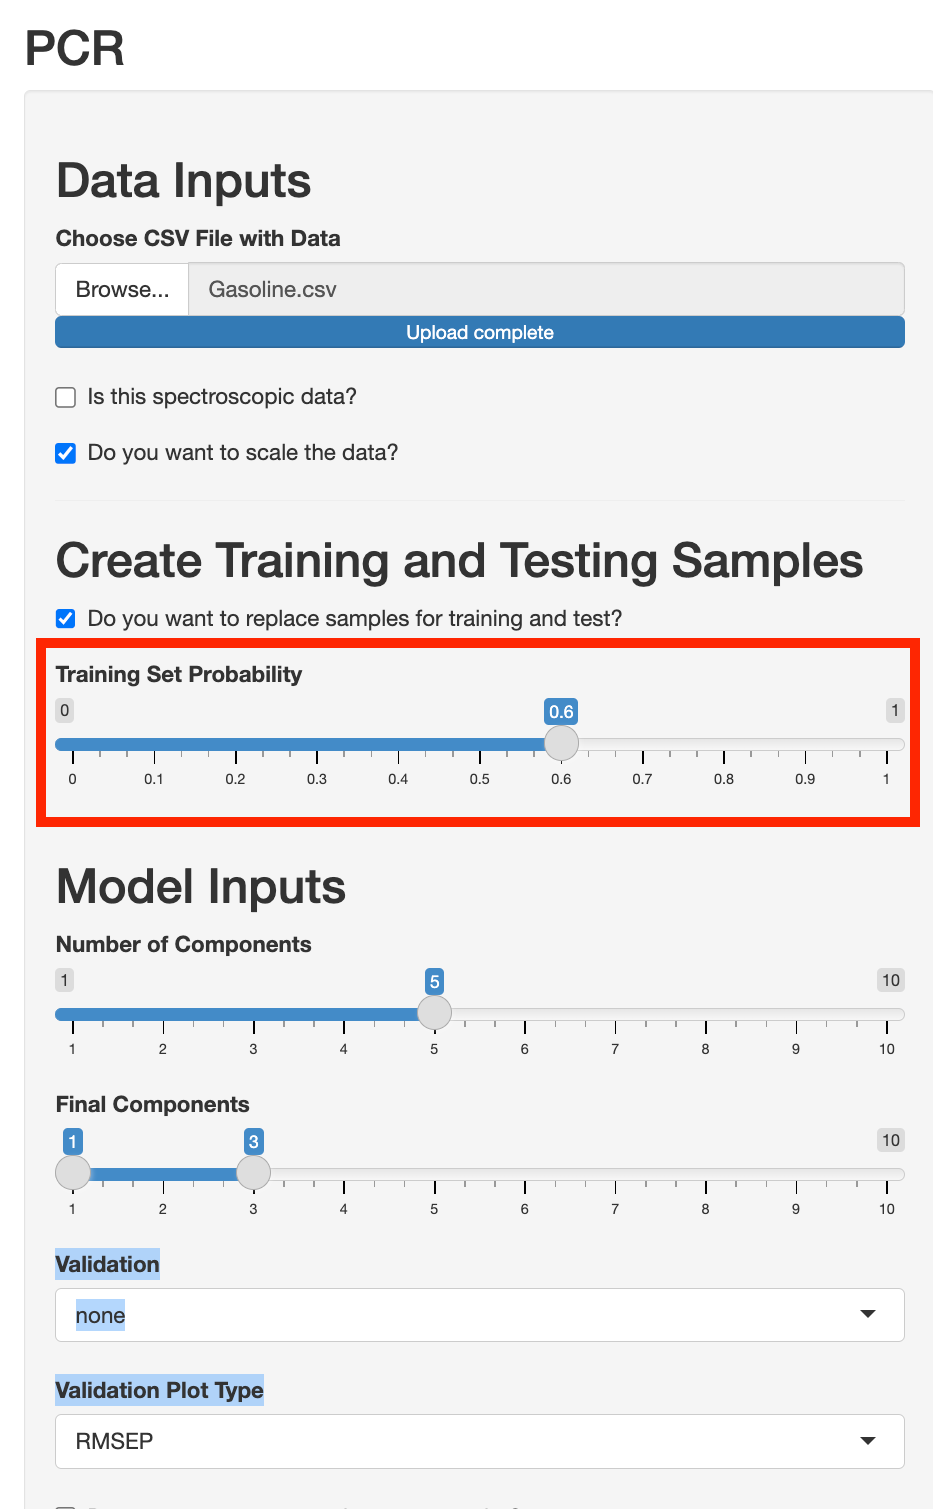
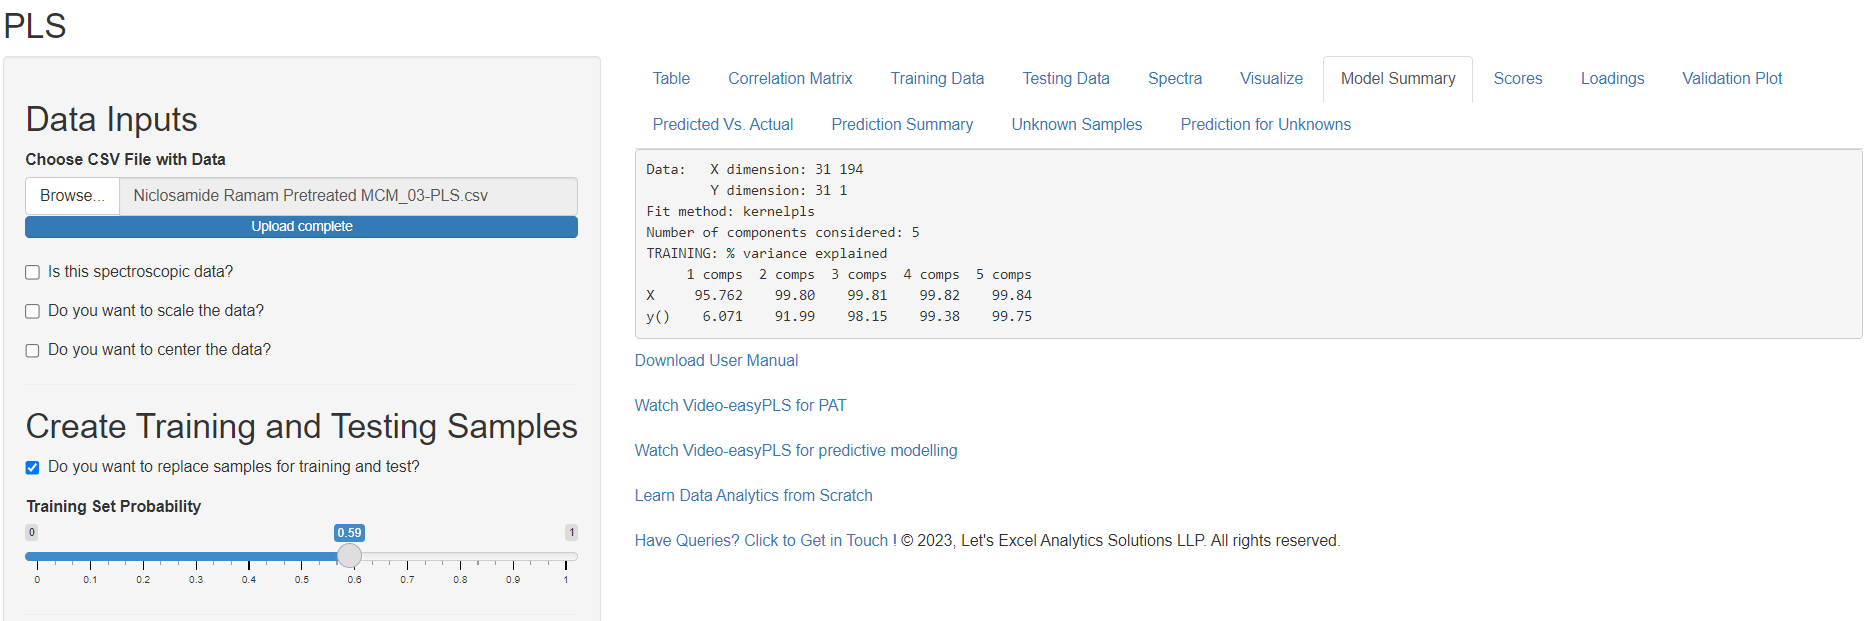
- easyPLS allows you to upload the dataset from your local device upto 128 mb to the platform and also user can scale the data for better view.
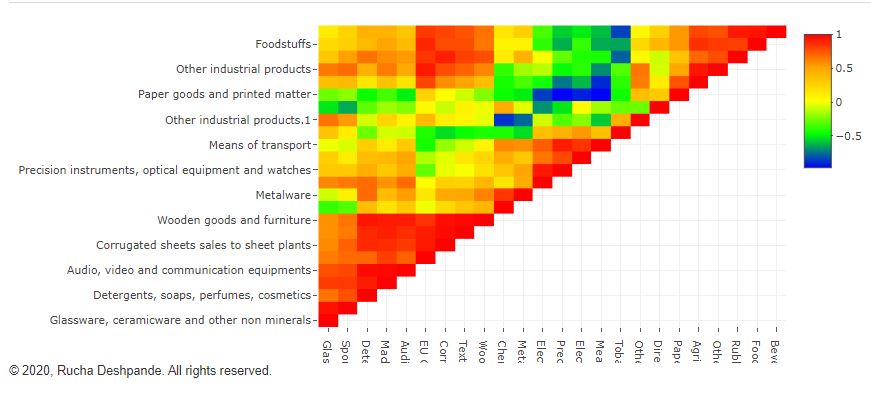
- easyPLS provides users with a “Correlation matrix” feature to predict the relationship between variables from the dataset. It provides a beautiful chart view for better correlation of the data points. Here the 1 (Red) indicates high correlation and -1(Blue) indicates low correlation.
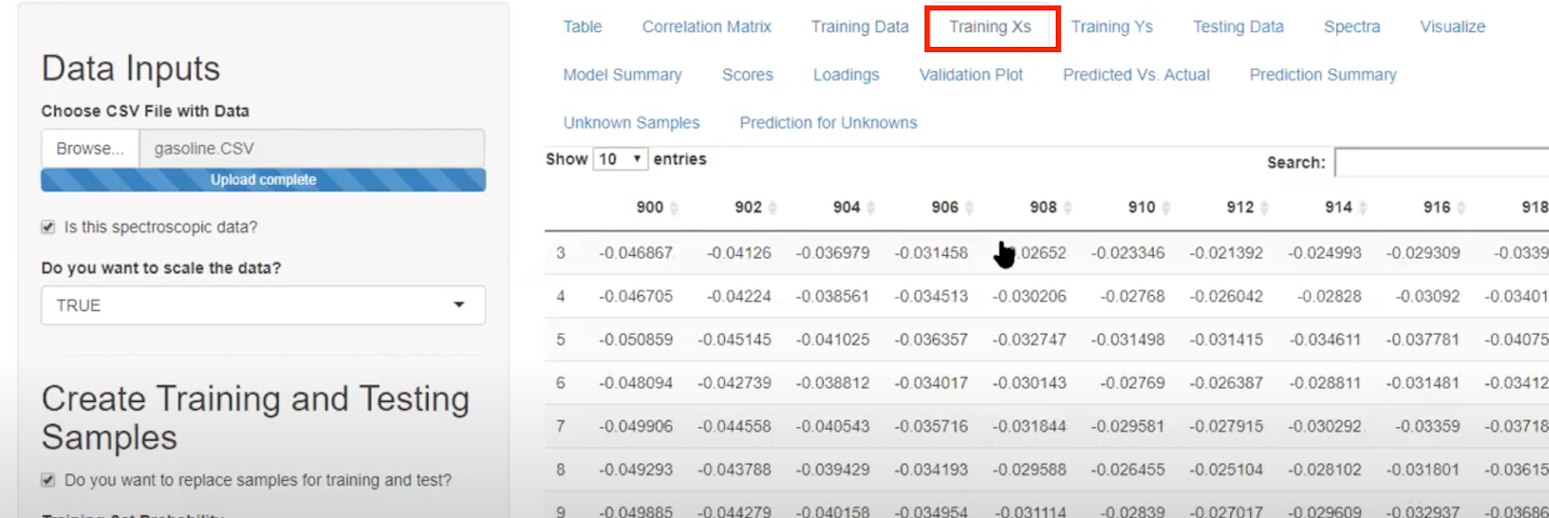
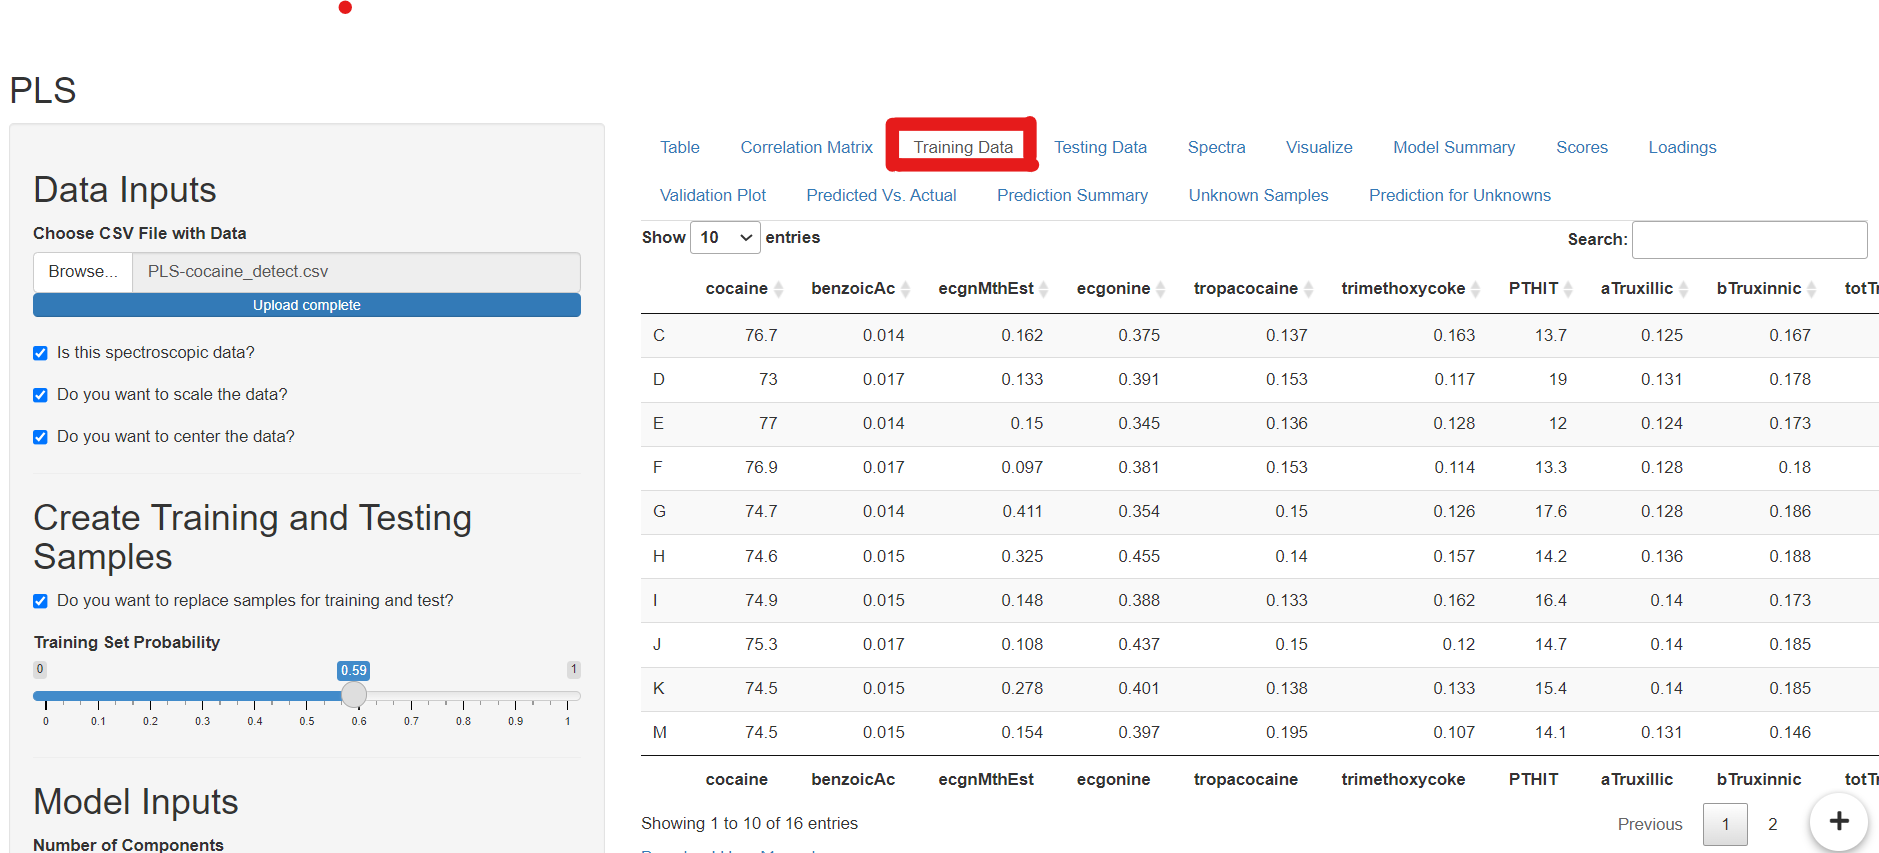
- easyPLS also provides us a “Training Data” feature which shows the training dataset and the ratio of training dataset which can be ad with the help of “Training Set Probability slider”
- Training Data shows the Data used for Training the Model
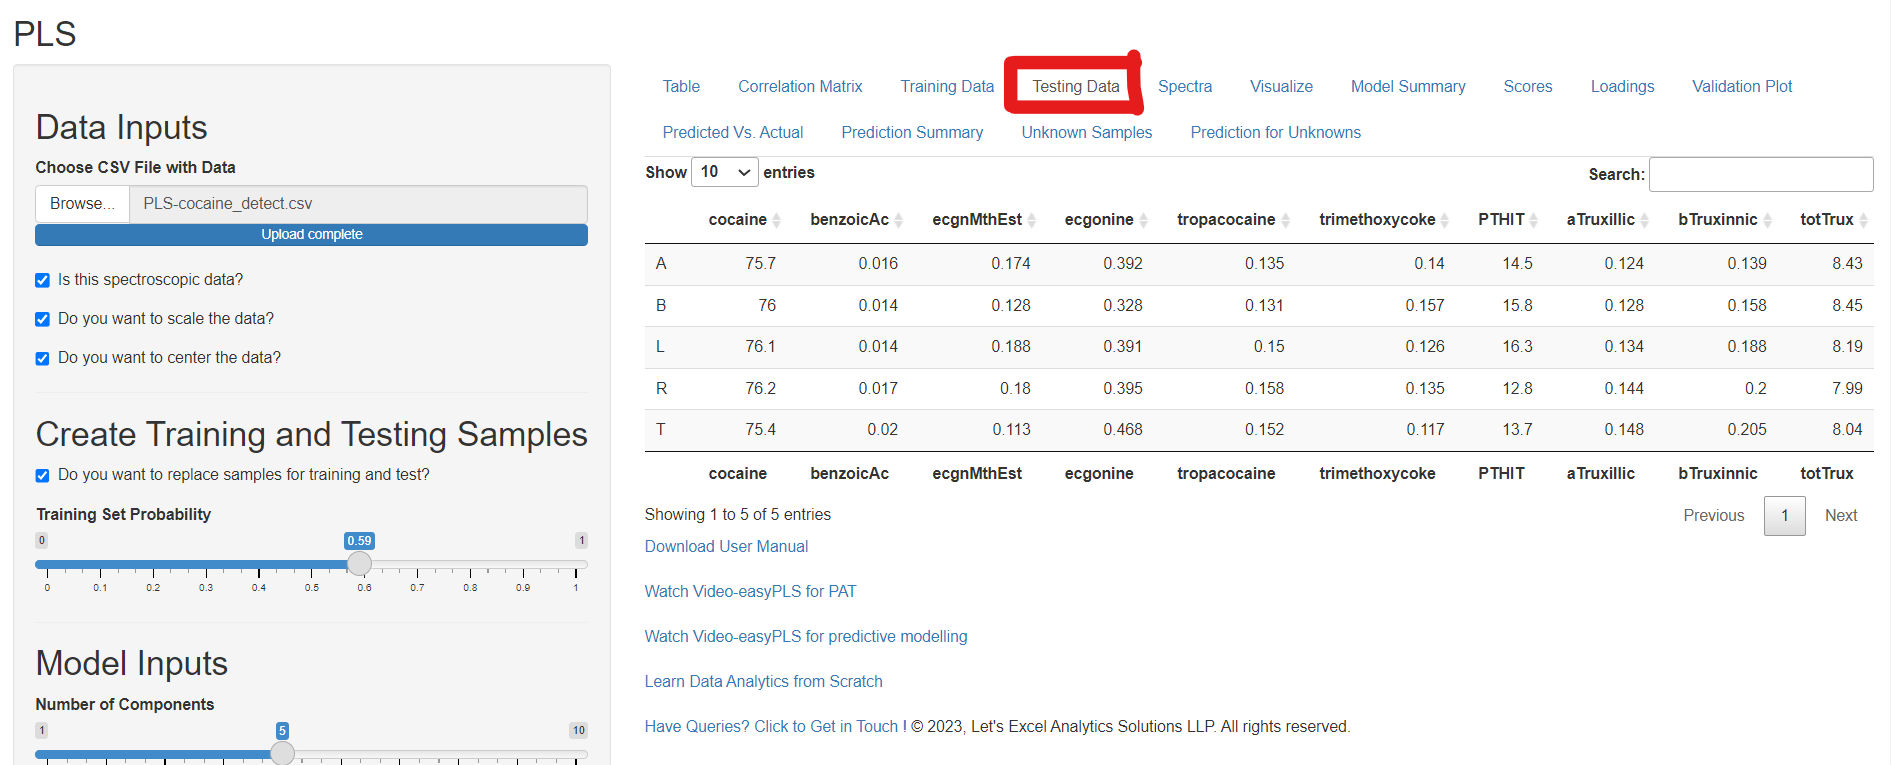
- “Testing Data” option will show you the ratio of the dataset which is in the testing set. The testing data can be increased by sliding the slider on “Training Set Probability”.
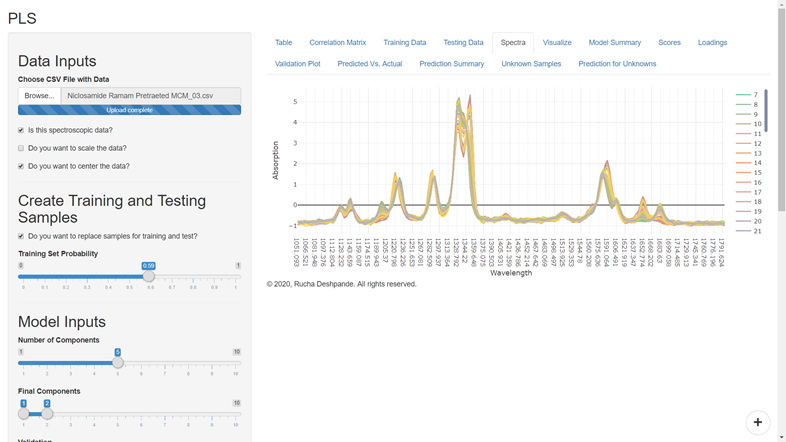
- easyPLS has an option of “Spectra”which shows the spectroscopy view of the dataset.
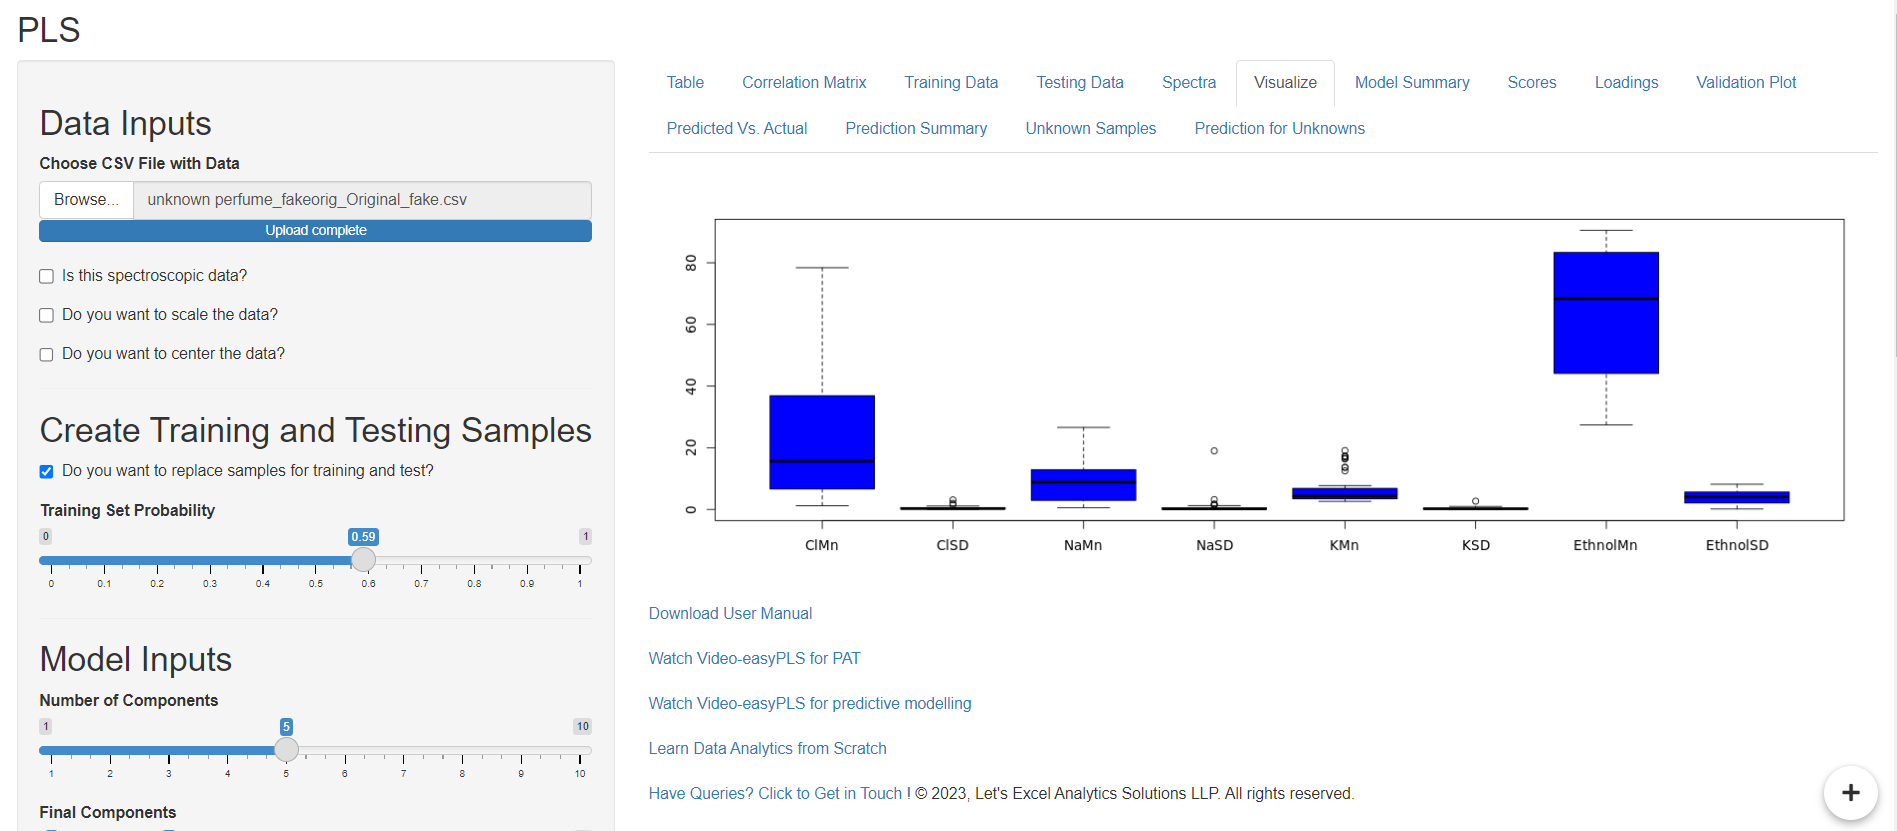
- EastPLS allows the “Visualize” feature which allows the user to get a boxplot view if the dataset does not support spectroscopy or vice versa.
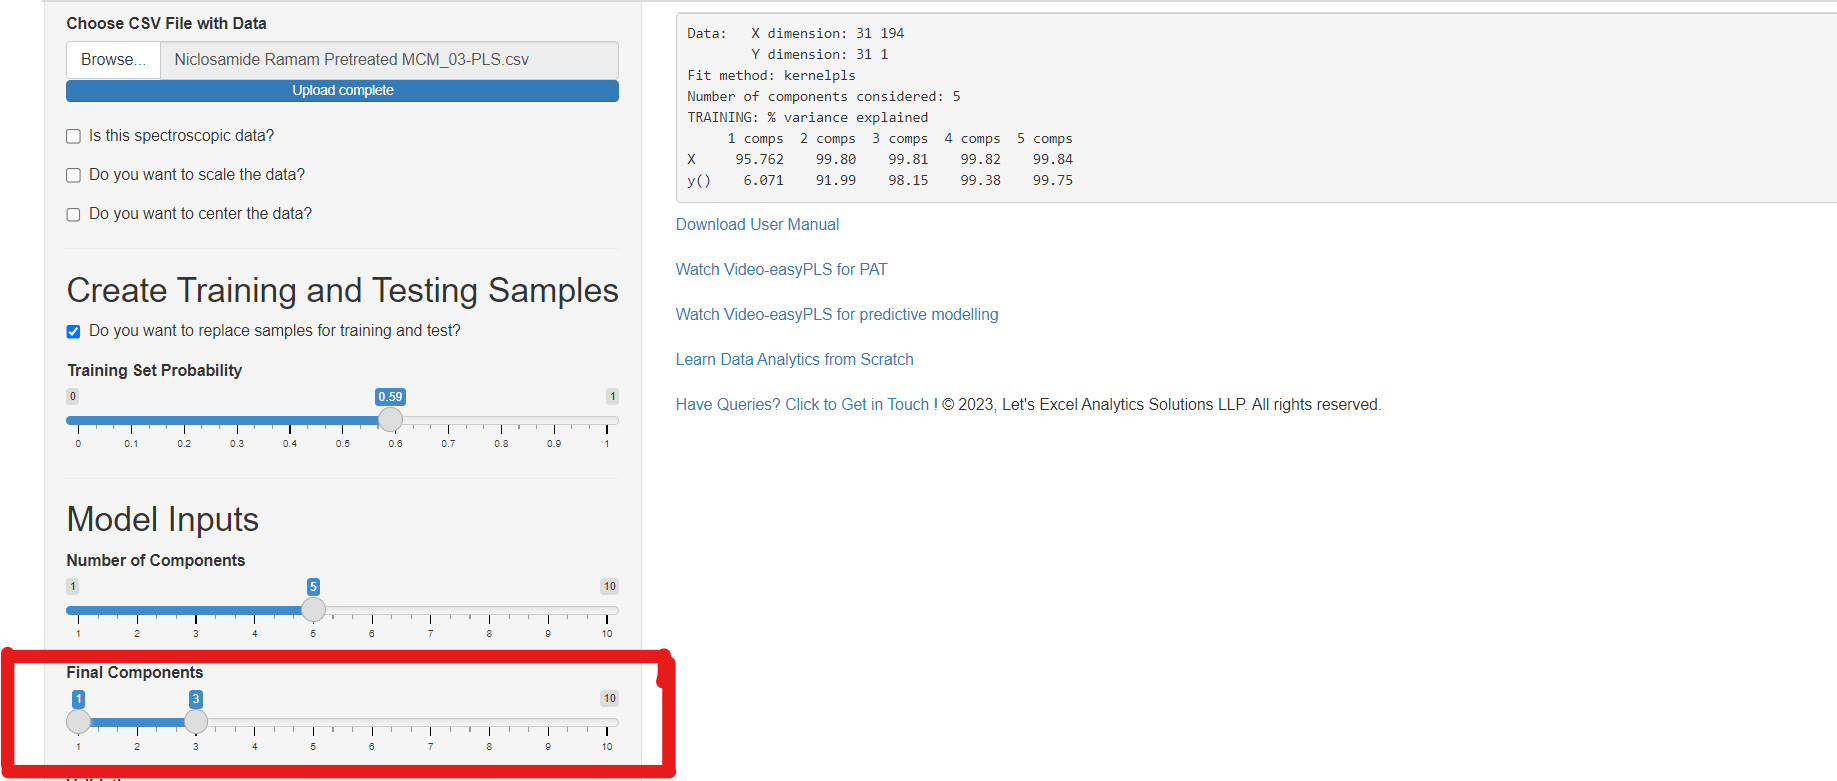
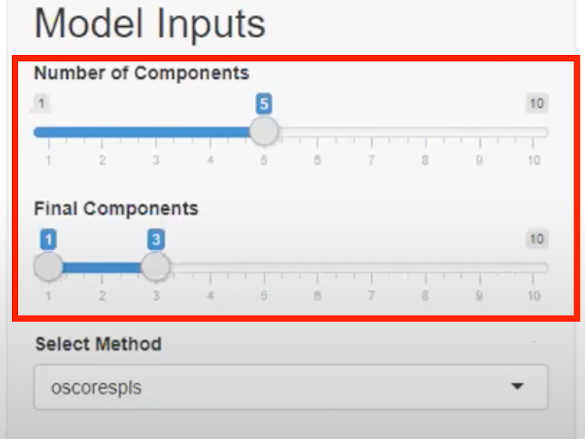
- “Model Summary” feature allows users to get PLS model summary of the training dataset and the calculations of the algorithm. User can also set the number of components he wants from the “Number of Component” slider and similarly the final components from the “Final Component” slider.
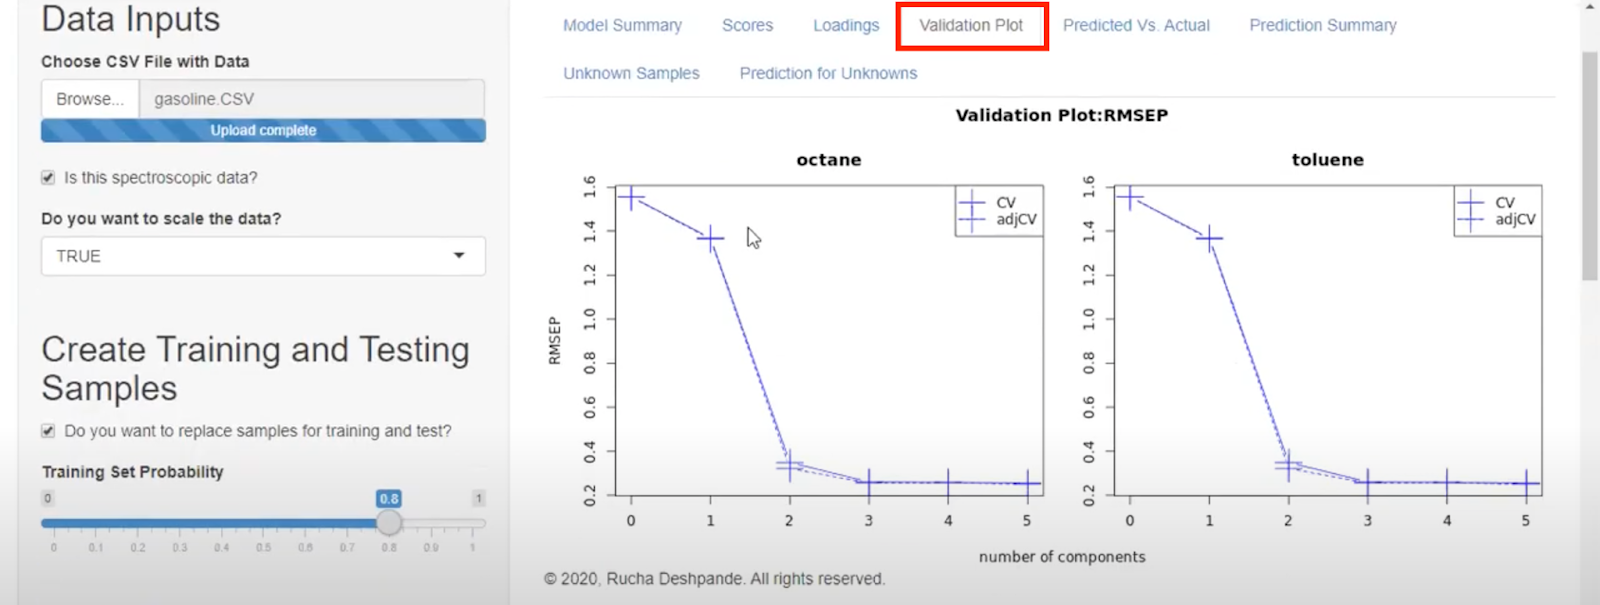
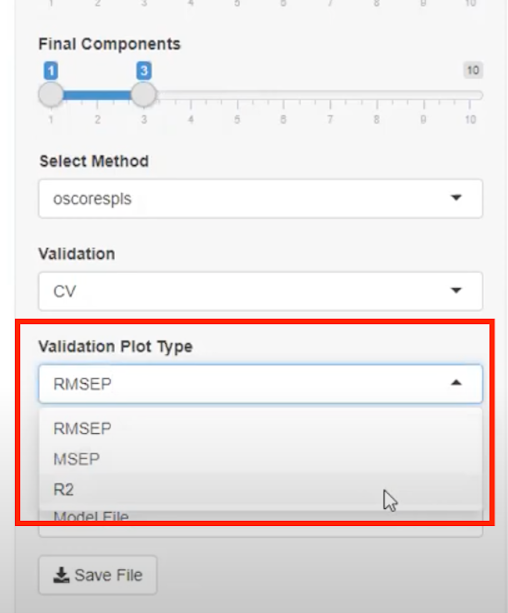
- “Validation Plot” option plots the graphical view of the model summary for easy visualization. Moreover we can select different graphical views from “Validation Plot Type”.
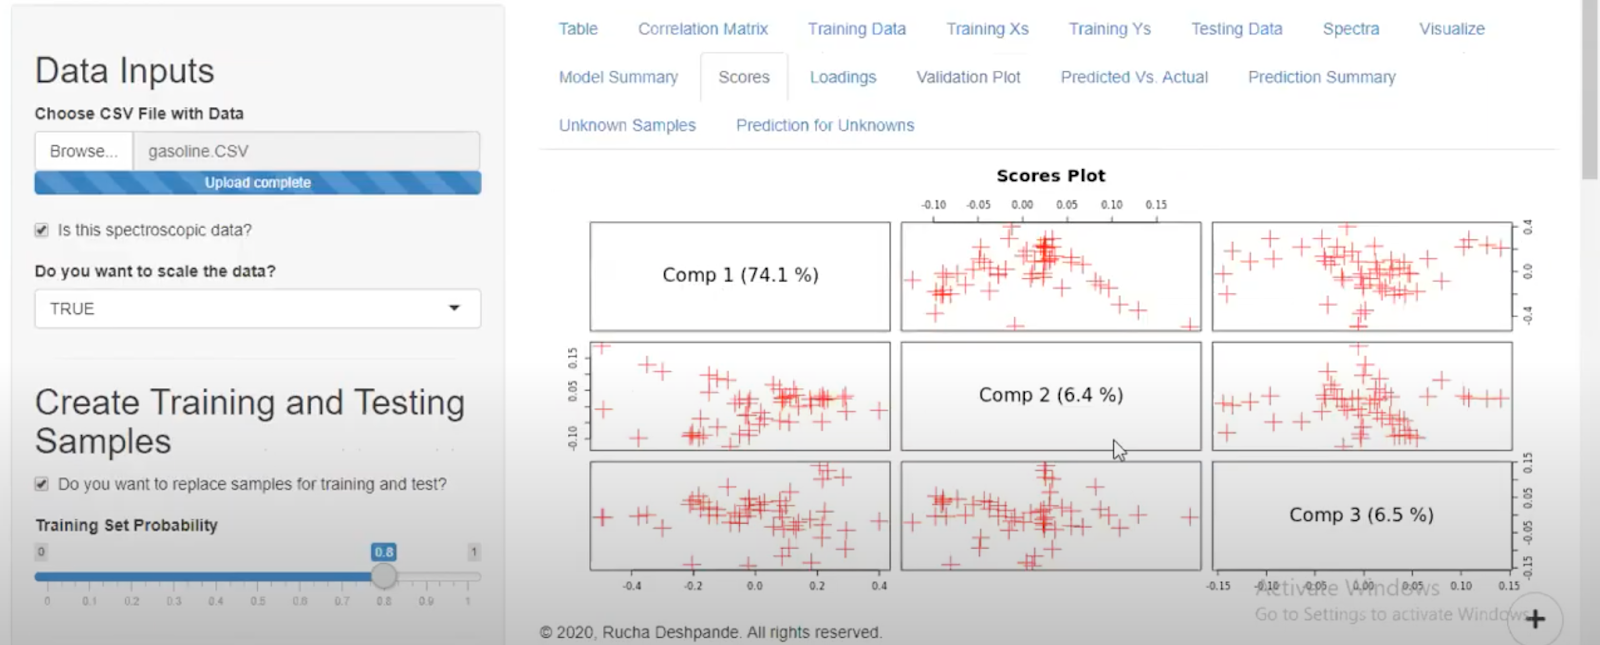
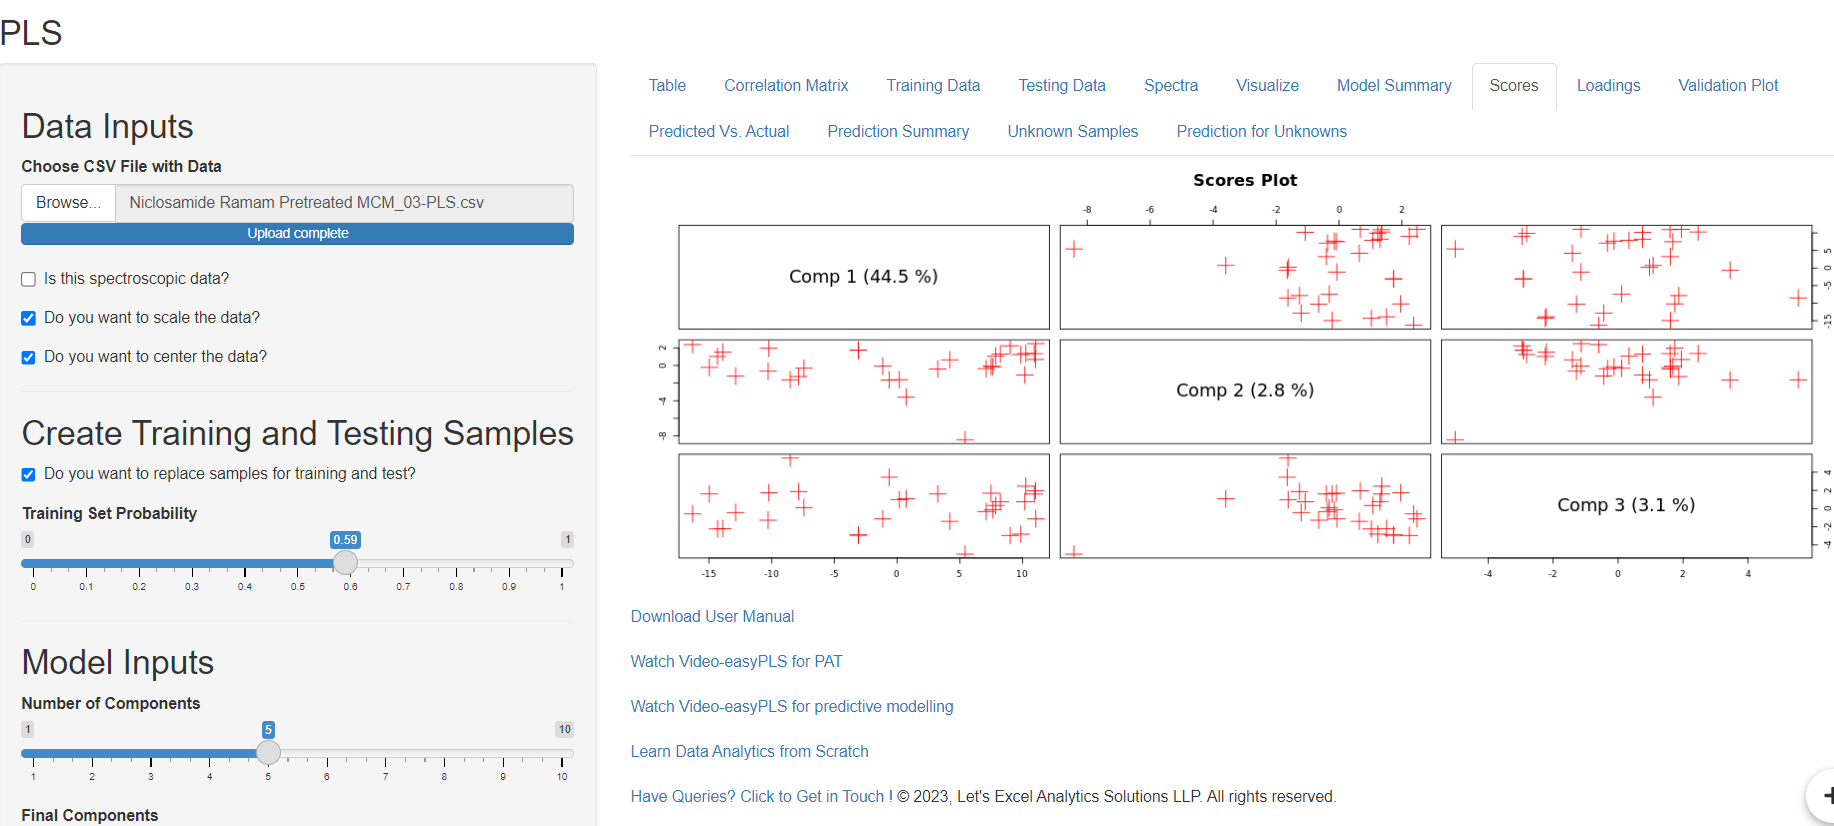
- easyPLS provides user “Score” options which shows the position of the sample with respect to multiple components.

- “Number of components”and “Final Component” can be adjusted with the help of a slider to get more analysis of the sample.
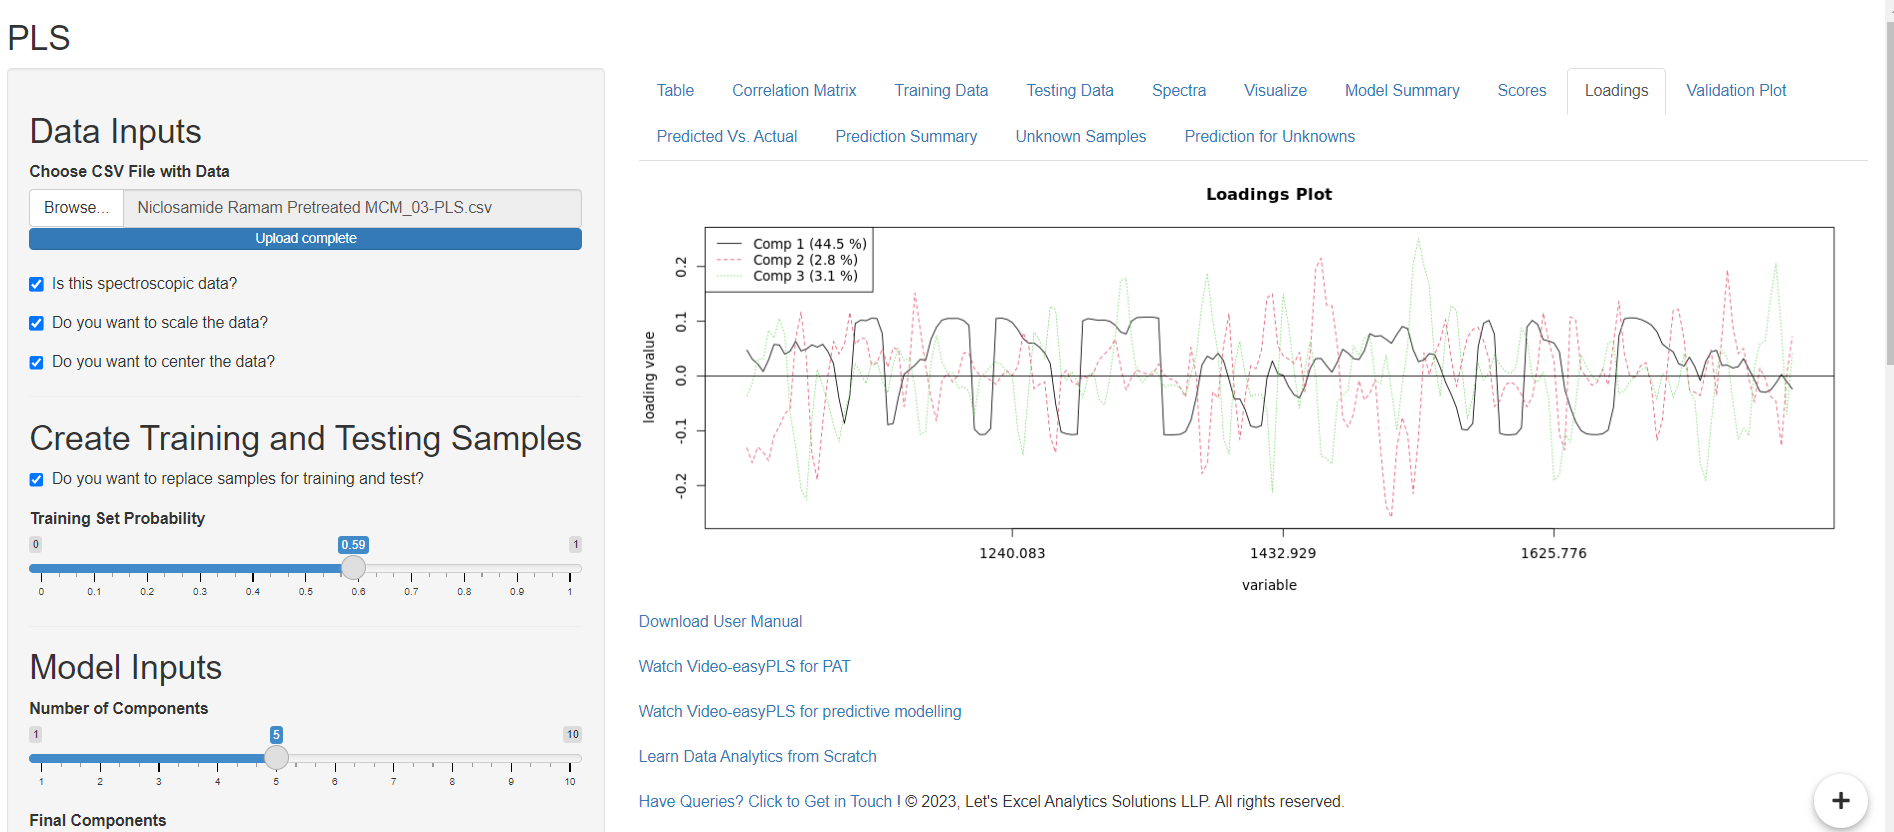
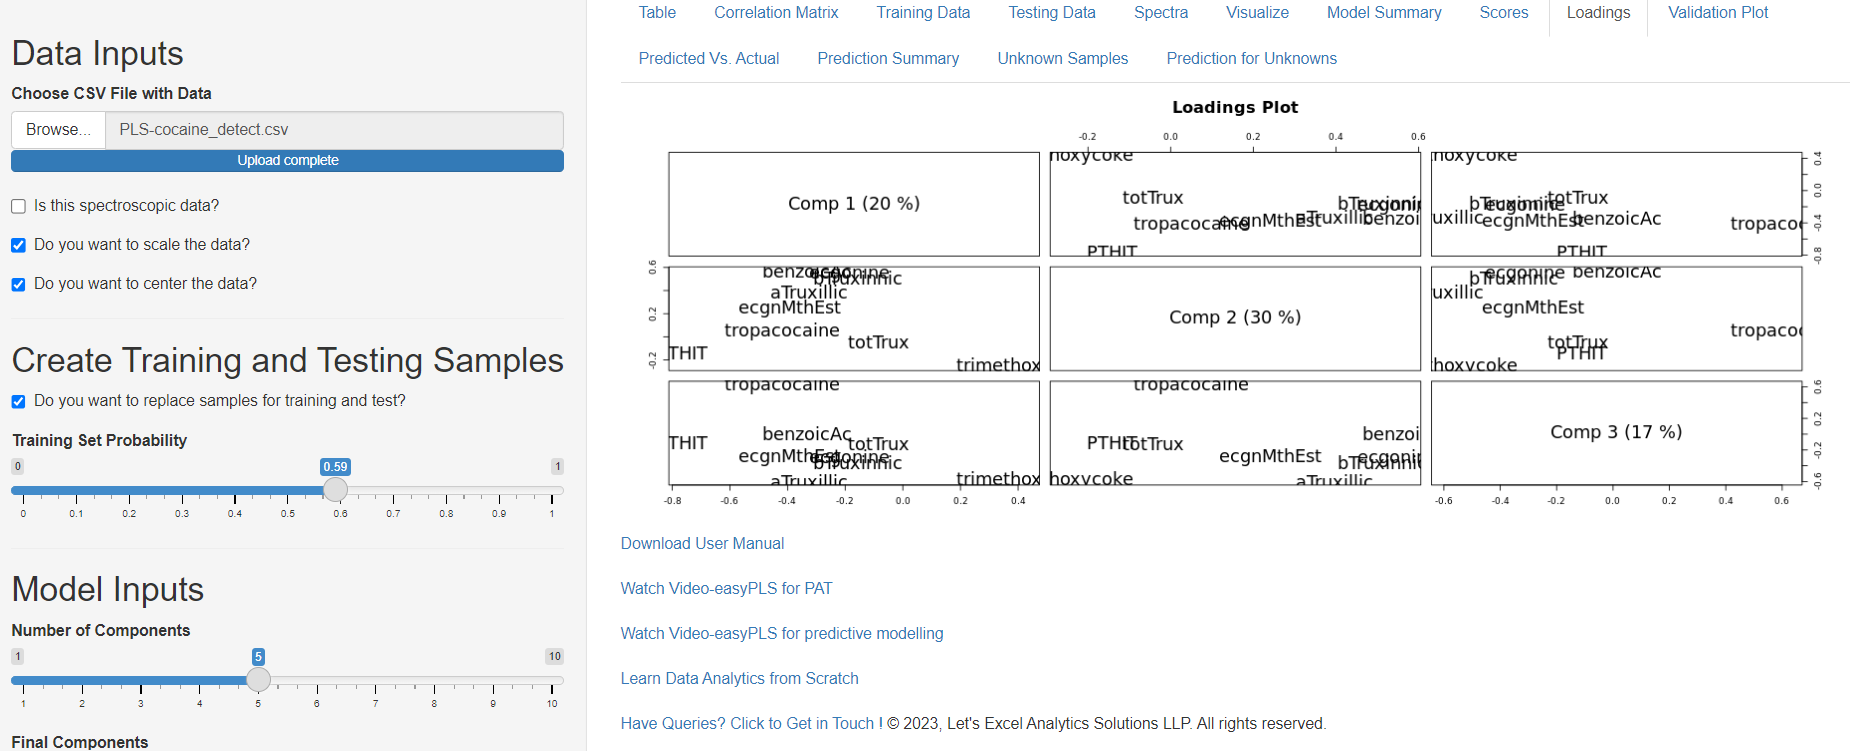
- “Loading” Option will provide the user graphical 2D view of the variable with respect to loading value. In case of spectroscopy data the loading view will look like:
In the case of nonspectroscopic data, the loading view will look like :
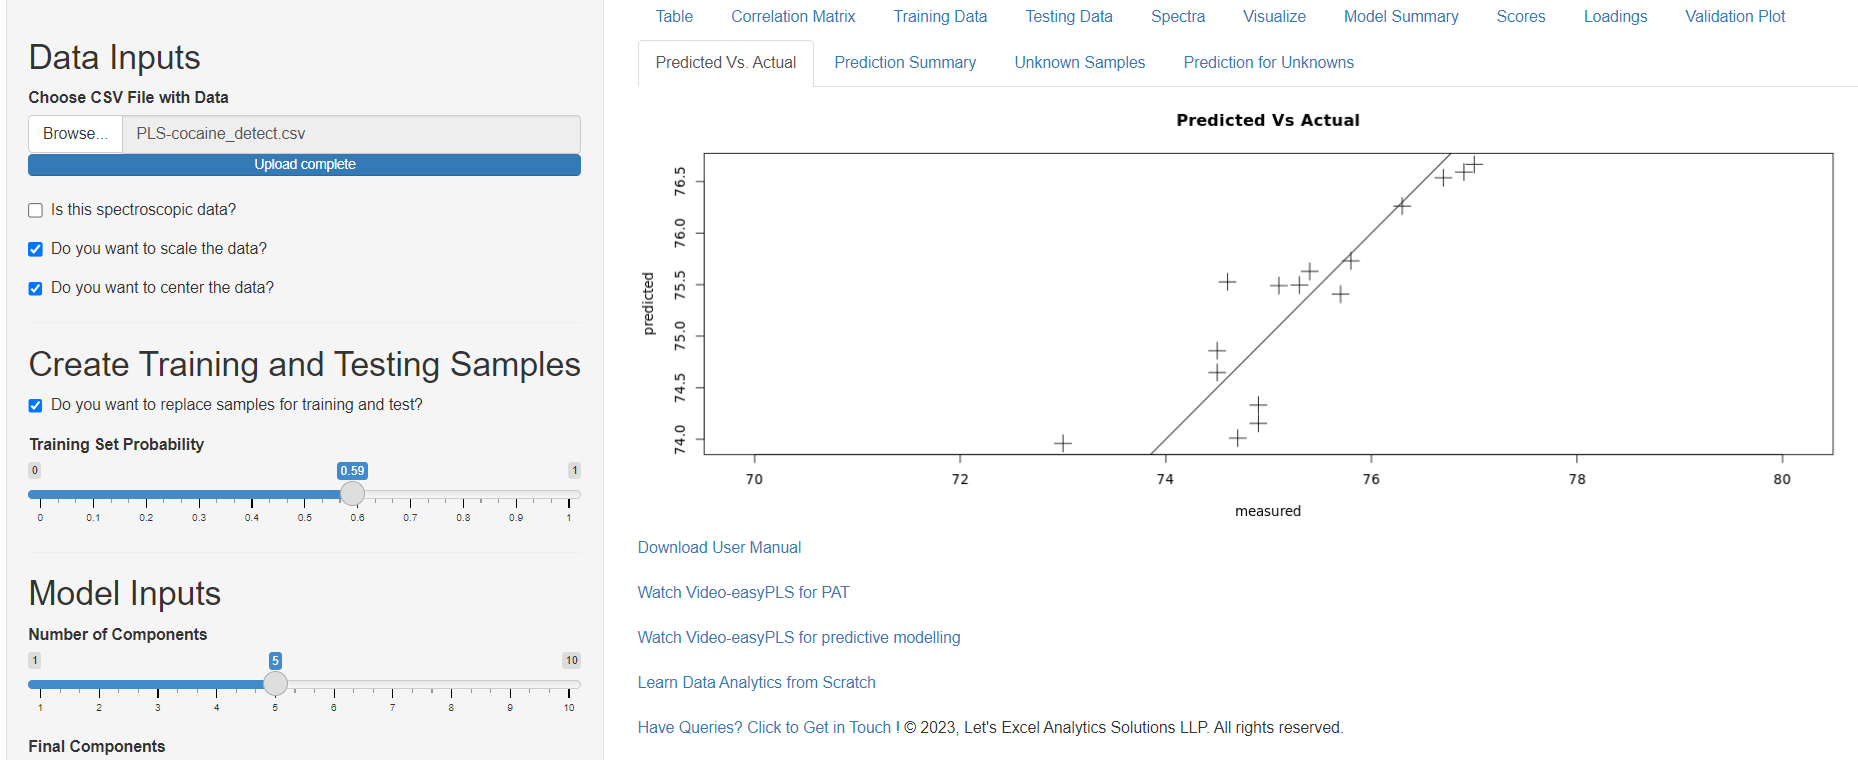
- easyPLS provides a user “Predicted vs Actual” feature that allows a graphical view of the predicted value of the dependent variable in agreement of actual values.
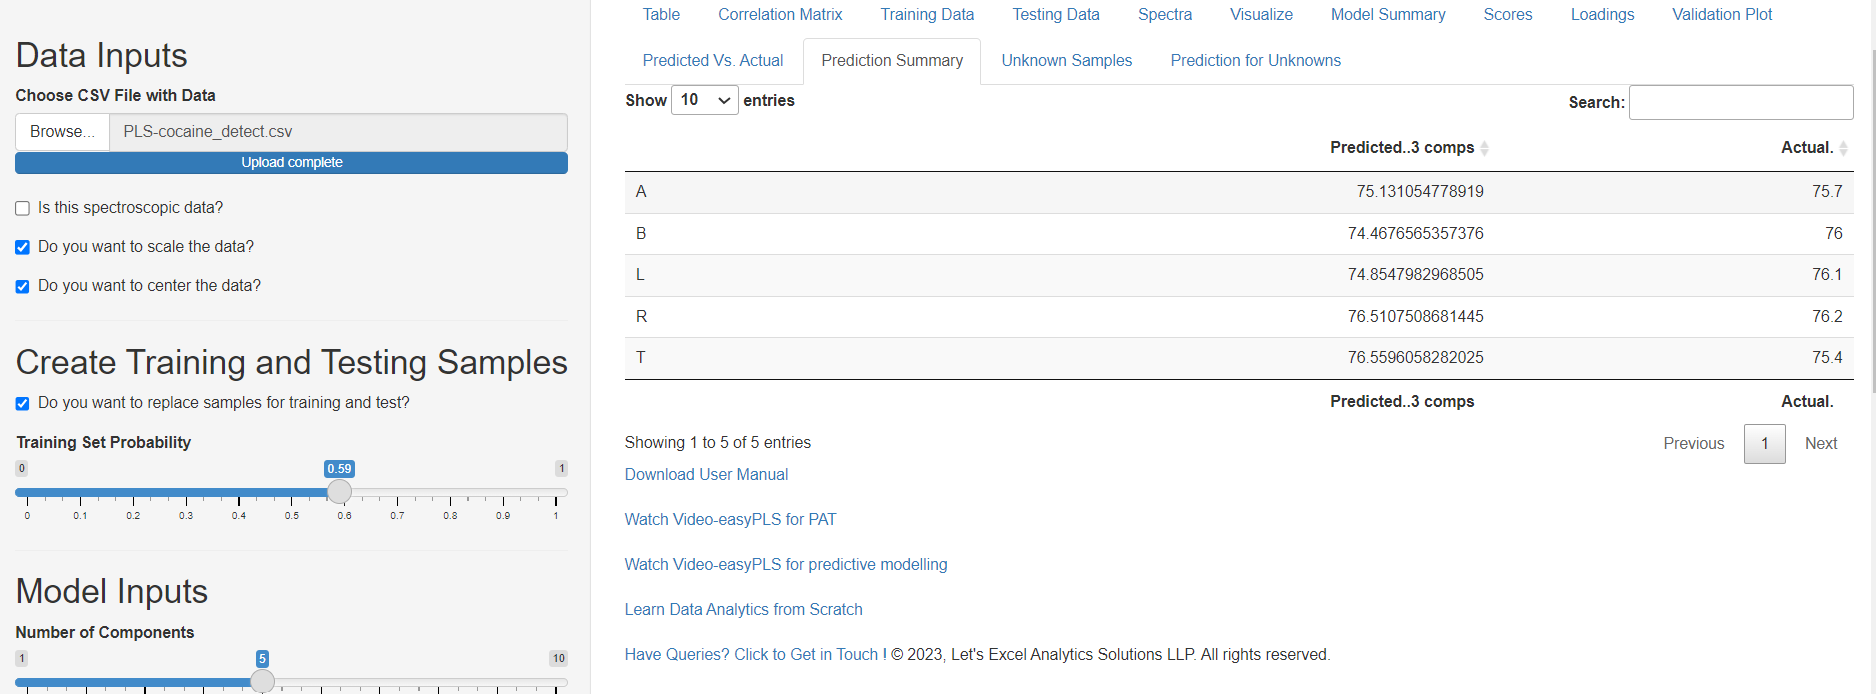
- “Prediction Summary” shows the tabular view of predicted data points from the Testing Data.
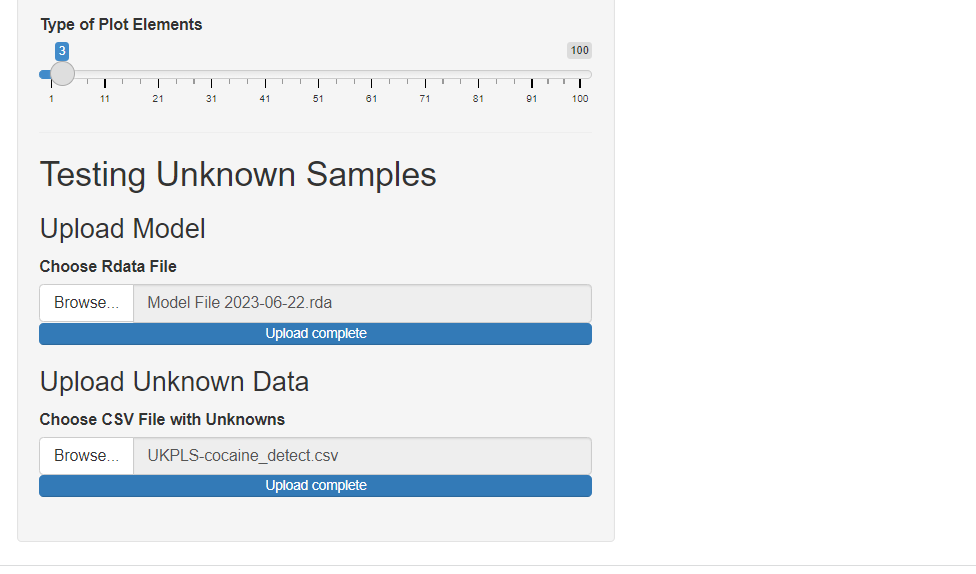
A dataset with independent variables and the previously built model can be uploaded from “Upload Unknown Data” and “Upload Model” feature to get predicted values of unknown data.
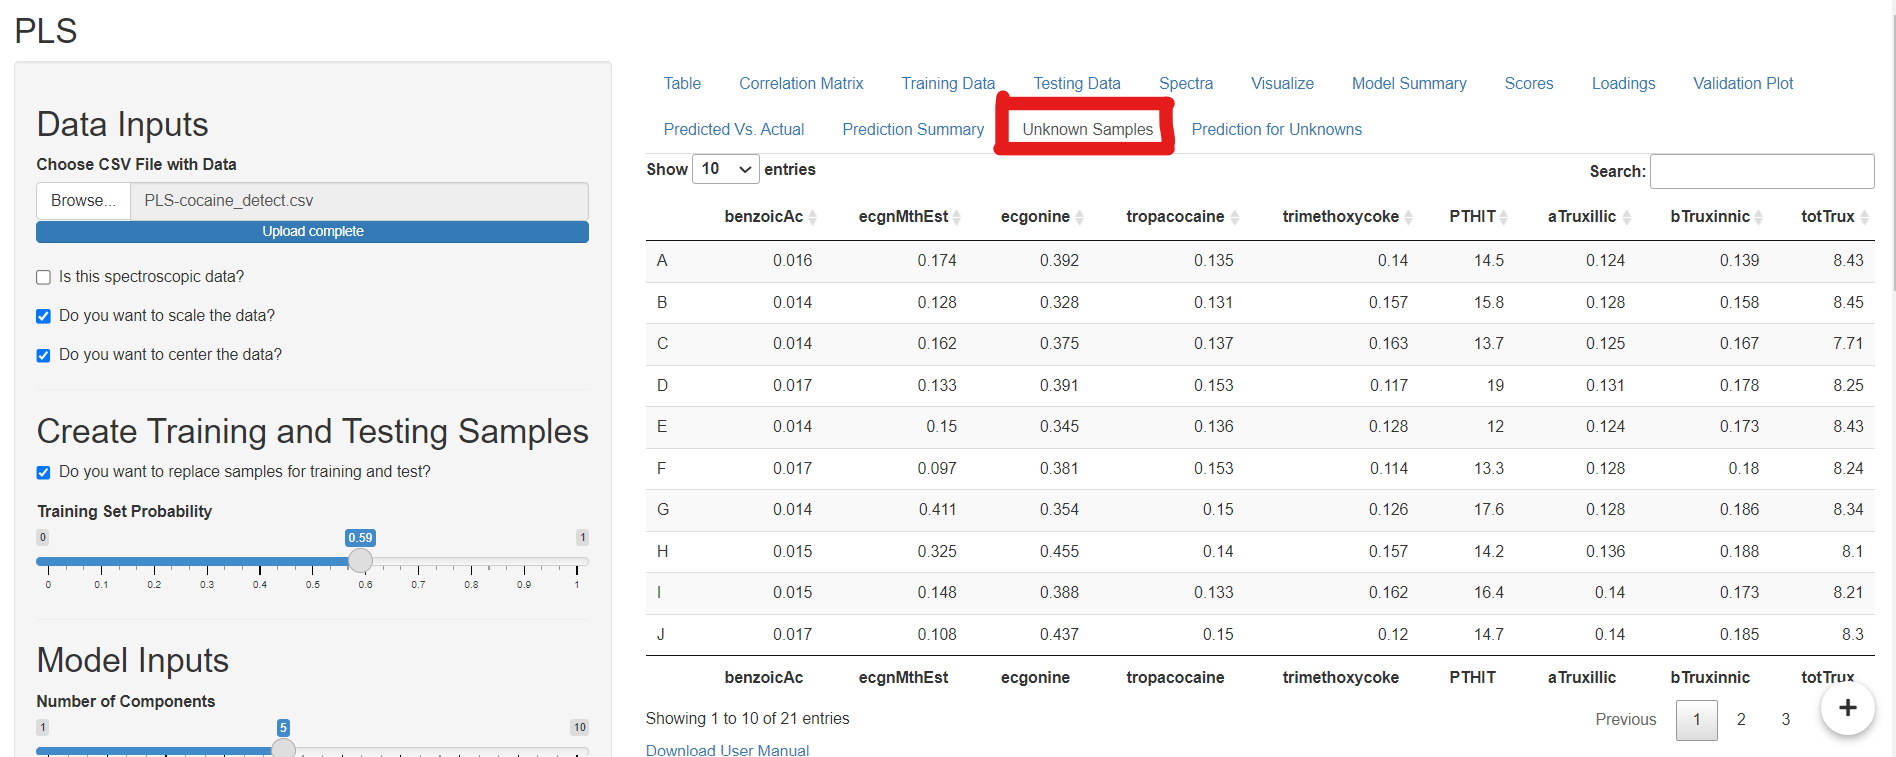
- “Unknown Sample” allows the user to get the tabular view of data points of independent variables in a tabular form from the file added via “Upload Unknown Data”.
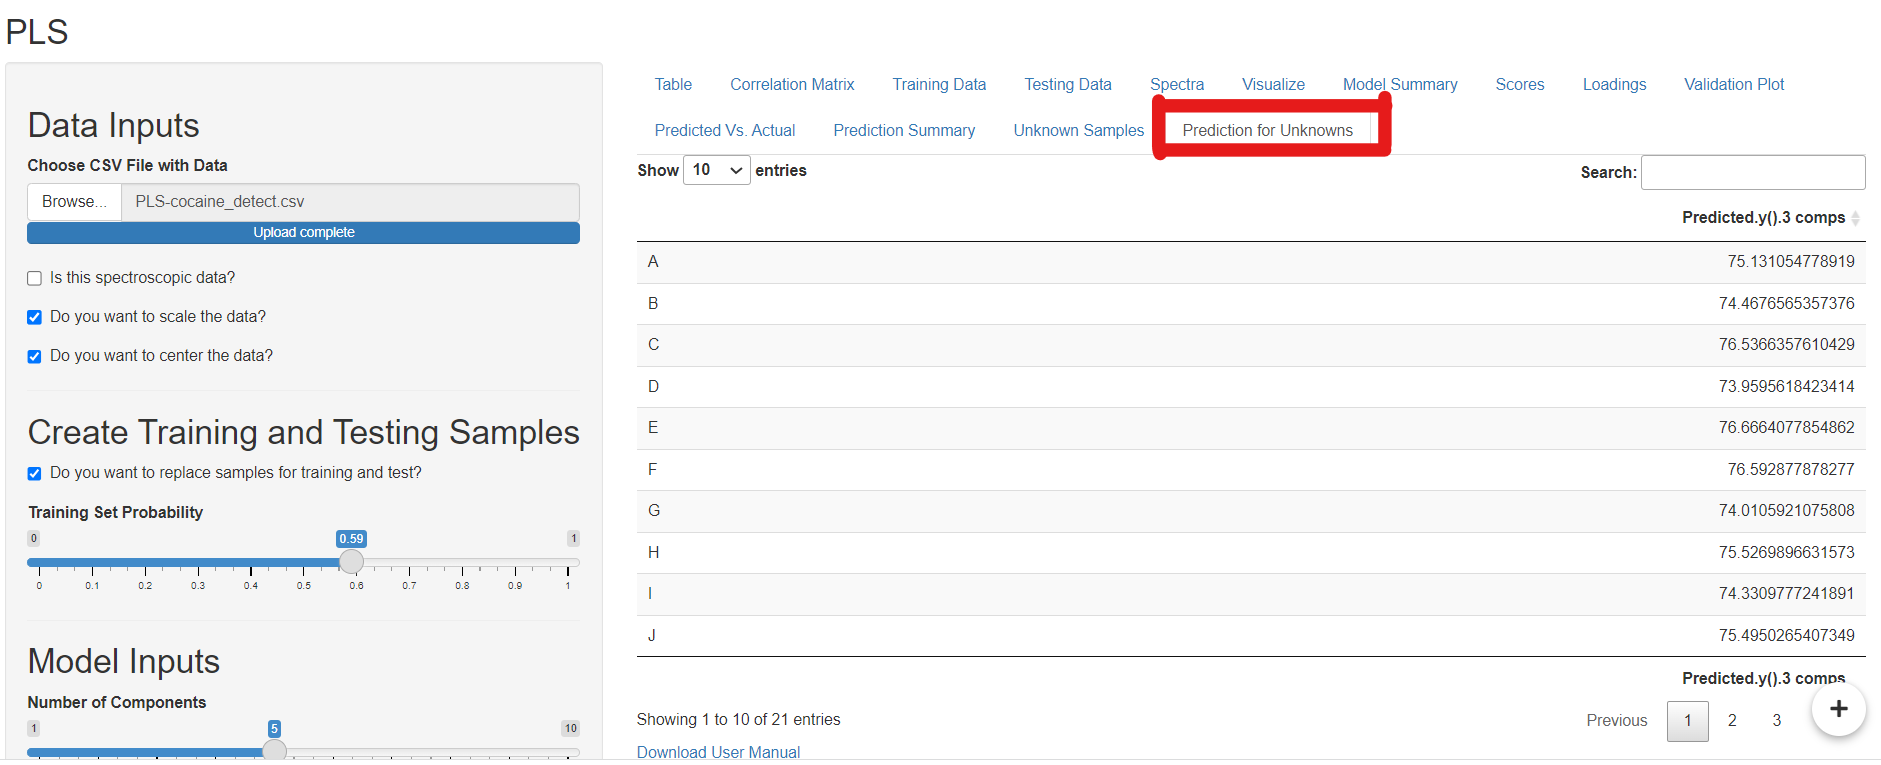
- “Prediction for Unknowns” will allow users to get predicted values of dependent variables from independent data points uploaded via “Upload Unknown Data”.
Interested in exploring data analytics case studies using niceLDA? Download our free data analytics case studies here Or purchase our Data Analytics Case Studies e-Book on Amazon.