Introduction:
niceLDA helps you perform cloud-based computations for the Linear Discriminant Analysis (LDA)
- Linear Discriminant Analysis(LDA) is commonly known as Normal Discriminant Analysis(NDA) or Discriminant Function Analysis (DFA). This model is commonly used in order to solve problems involving more than two classes of classification.
- Our Platform will provide you with a web-based solution for Linear Discriminant Analysis. It is widely used to solve classification problems where one needs to segregate different samples into their respective class or group. This technique works well when basic assumptions related to data normality are followed by the data.
- A SaaS Cloud Platform will be provided to the user for data analytics anytime,anywhere.
Applications of LDA:
Lifesciences :
- Cancer diagnosis: LDA can be used to distinguish between benign and malignant tumors based on measurements of various features such as size, shape, and texture.
- Drug discovery: LDA can be used to analyze the structure-activity relationship of various compounds, to predict the activity of new compounds based on their chemical structure, and to identify promising drug candidates for further development.
- Disease diagnosis: LDA can be used to distinguish between different types of diseases based on their symptoms, lab tests, and other diagnostic criteria.
- Genomics: LDA can be used to analyze gene expression data and identify genes that are differentially expressed between different groups, such as healthy vs. diseased individuals or drug-treated vs. untreated cells.
- Proteomics: LDA can be used to analyze proteomic data and identify proteins that are differentially expressed between different groups, such as healthy vs. diseased individuals or drug-treated vs. untreated cells.
- Microbiology: LDA can be used to analyze microbial communities and identify microbial taxa that are associated with specific environmental conditions, such as pH, temperature, and nutrient availability.
Food And Beverages:
- LDA can be used to analyze sensory data and identify the key attributes that differentiate different types of foods, such as sweetness, acidity, texture, and aroma.
- Sensory evaluation: LDA can be used to analyze sensory data such as taste, texture, and aroma to differentiate between different food and beverage products. For example, LDA can be used to identify the sensory attributes that distinguish between different types of wine, cheese, or coffee.
- Quality control: LDA can be used to classify food and beverage products based on their quality. For example, LDA can be used to classify coffee beans based on their grade, or to classify wine based on its vintage.
- Food safety: LDA can be used to identify food safety hazards by analyzing data from different sources, such as microbiological tests, environmental monitoring, and chemical analysis. For example, LDA can be used to identify the factors that contribute to foodborne illness outbreaks.
- Product development: LDA can be used to identify the most important sensory attributes of a new food or beverage product and to optimize the formulation to meet customer preferences. For example, LDA can be used to determine the optimal levels of sugar, salt, and fat in a new snack food product.
- Consumer research: LDA can be used to analyze consumer data, such as surveys or focus groups, to identify the factors that influence consumer preferences for different food and beverage products. For example, LDA can be used to determine the factors that influence consumers’ preferences for different types of beer or coffee.
Agriculture Sector:
- Crop classification: LDA can be used to classify different crop types based on their spectral characteristics. For example, LDA can be used to classify different types of crops such as wheat, corn, and soybeans, based on their spectral signature captured from remote sensing data.
- Soil analysis: LDA can be used to analyze soil data, such as nutrient content and texture, to classify different types of soils based on their chemical and physical properties. For example, LDA can be used to classify soil types for precision agriculture applications.
- Crop disease detection: LDA can be used to detect crop diseases based on their spectral characteristics. For example, LDA can be used to detect plant diseases such as potato late blight, soybean rust, and wheat leaf rust based on the spectral signature of the infected leaves.
- Quality control: LDA can be used to classify agricultural products based on their quality. For example, LDA can be used to classify fruits and vegetables based on their maturity, ripeness, and quality, which can be useful in grading and sorting applications.
- Yield prediction: LDA can be used to predict crop yields based on historical data and environmental variables. For example, LDA can be used to predict crop yields based on variables such as temperature, precipitation, and soil moisture, which can help farmers to make informed decisions regarding crop management and marketing.
- Plant breeding: LDA can be used to analyze the genetic data of plants to identify desirable traits and to develop new plant varieties with higher yields, better disease resistance, and improved quality. For example, LDA can be used to analyze genetic data to identify desirable traits for breeding new varieties of crops.
Chemical Industry:
- Chemical analysis: LDA can be used to analyze chemical data, such as spectroscopy or chromatography data, to classify different chemicals or to detect impurities or contaminants. For example, LDA can be used to classify different types of polymers based on their molecular weight or to detect contaminants in a batch of chemicals.
- Quality control: LDA can be used to classify products based on their quality. For example, LDA can be used to classify pharmaceutical products based on their purity or potency, or to classify chemical products based on their composition and properties.
- Process control: LDA can be used to monitor and control chemical processes, such as reaction monitoring or process optimization. For example, LDA can be used to monitor the progress of a chemical reaction based on spectral data or to optimize a chemical process based on data from sensors and other process variables.
- Hazard analysis: LDA can be used to identify potential hazards in chemical production and handling. For example, LDA can be used to analyze data from safety sensors to identify potential safety hazards or to classify chemicals based on their potential for fire or explosion.
- Environmental analysis: LDA can be used to analyze environmental data, such as water quality data or air quality data, to classify different types of pollutants or to detect sources of contamination. For example, LDA can be used to classify different types of pollutants in water samples based on their chemical composition or to detect the source of air pollution based on data from air quality sensors.
Aeronautics and Astronomy:
- Object detection: LDA can be used to detect objects in images or videos captured by sensors, such as cameras or radar. For example, LDA can be used to classify different types of aircraft or spacecraft based on their shape and spectral characteristics.
- Signal analysis: LDA can be used to analyze signals, such as radio or light signals, to classify different types of sources. For example, LDA can be used to classify different types of stars based on their spectral signature.
- Fault detection: LDA can be used to detect faults in aircraft or spacecraft systems based on sensor data. For example, LDA can be used to detect engine faults based on data from sensors that measure engine parameters.
- Mission planning: LDA can be used to classify different types of mission scenarios based on environmental variables and other mission parameters. For example, LDA can be used to classify different types of landing scenarios based on variables such as wind speed and direction, terrain slope, and landing site conditions.
- Navigation: LDA can be used to classify different types of navigation scenarios based on sensor data and other navigation parameters. For example, LDA can be used to classify different types of navigation scenarios, such as landing or docking scenarios, based on data from sensors that measure distance, speed, and direction.
- Spacecraft design: LDA can be used to analyze data from previous spacecraft missions to identify patterns and trends that can be used to improve spacecraft design. For example, LDA can be used to analyze data from previous missions to identify the most important design factors for improving spacecraft performance and reliability.
Business Intelligence:
- Customer segmentation: LDA can be used to segment customers based on their demographic, behavioral, or transactional data. For example, LDA can be used to segment customers based on their purchase history, age, gender, and other variables.
- Fraud detection: LDA can be used to detect fraudulent transactions or activities based on historical data and other variables. For example, LDA can be used to detect credit card fraud based on transactional data and other variables, such as location and time of day.
- Market research: LDA can be used to analyze data from market research surveys to identify patterns and trends. For example, LDA can be used to identify the most important factors that influence customer satisfaction or to identify market segments based on customer preferences.
- Product development: LDA can be used to analyze data from product development surveys to identify the most important features or attributes that customers value. For example, LDA can be used to identify the most important product features that influence customer purchase decisions.
- Financial analysis: LDA can be used to classify different types of financial events, such as mergers and acquisitions or stock price movements, based on historical data and other variables. For example, LDA can be used to classify different types of financial events based on variables such as company size, industry, and financial ratios.
- Risk management: LDA can be used to classify different types of risks, such as credit risk or operational risk, based on historical data and other variables. For example, LDA can be used to classify different types of credit risk based on variables such as credit score, income, and debt-to-income ratio.
Why choose niceLDA for Research?
- Dimensionality reduction: LDA can be used to reduce the dimensionality of a dataset by projecting the data onto a lower-dimensional subspace while preserving the discriminative information between the classes. This can lead to improved classification accuracy and reduced computation time.
- Simple and fast: LDA is a simple and computationally efficient algorithm that can be trained quickly on large datasets. This makes it ideal for real-time applications and scenarios where computational resources are limited.
- Robust to noise and outliers: LDA is a robust algorithm that is able to handle noisy and incomplete data without overfitting or underfitting. This is because LDA uses a linear decision boundary that is less sensitive to outliers and noise than other non-linear algorithms.
- Interpretable results: LDA produces results that are easy to interpret and explain. This is because LDA projects the data onto a lower-dimensional subspace that can be visualized and analyzed.
- Feature selection: LDA can be used for feature selection, which is the process of identifying the most relevant features that contribute to the classification accuracy. This can lead to improved classification performance and reduced computation time.
- Multiclass classification: LDA can be used for multiclass classification tasks, which is the process of classifying data into more than two classes. LDA can be used to find a linear decision boundary that separates the data into multiple classes with high accuracy.
What does niceLDA bring for you?
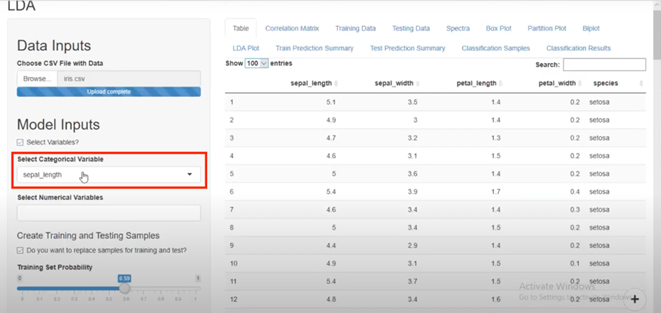
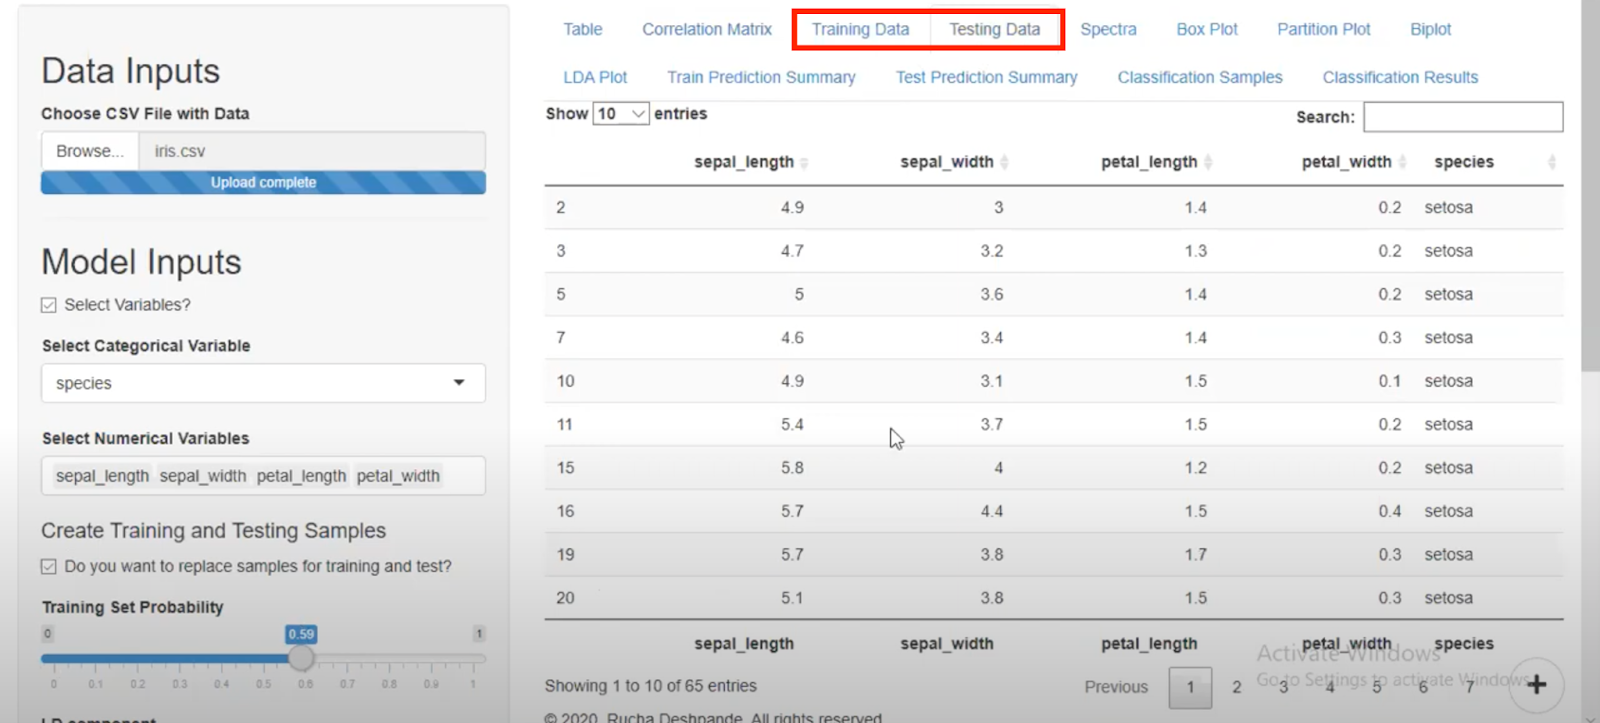
niceLDA allows you to select Numerical as well as Categorical Variables separately for analytics

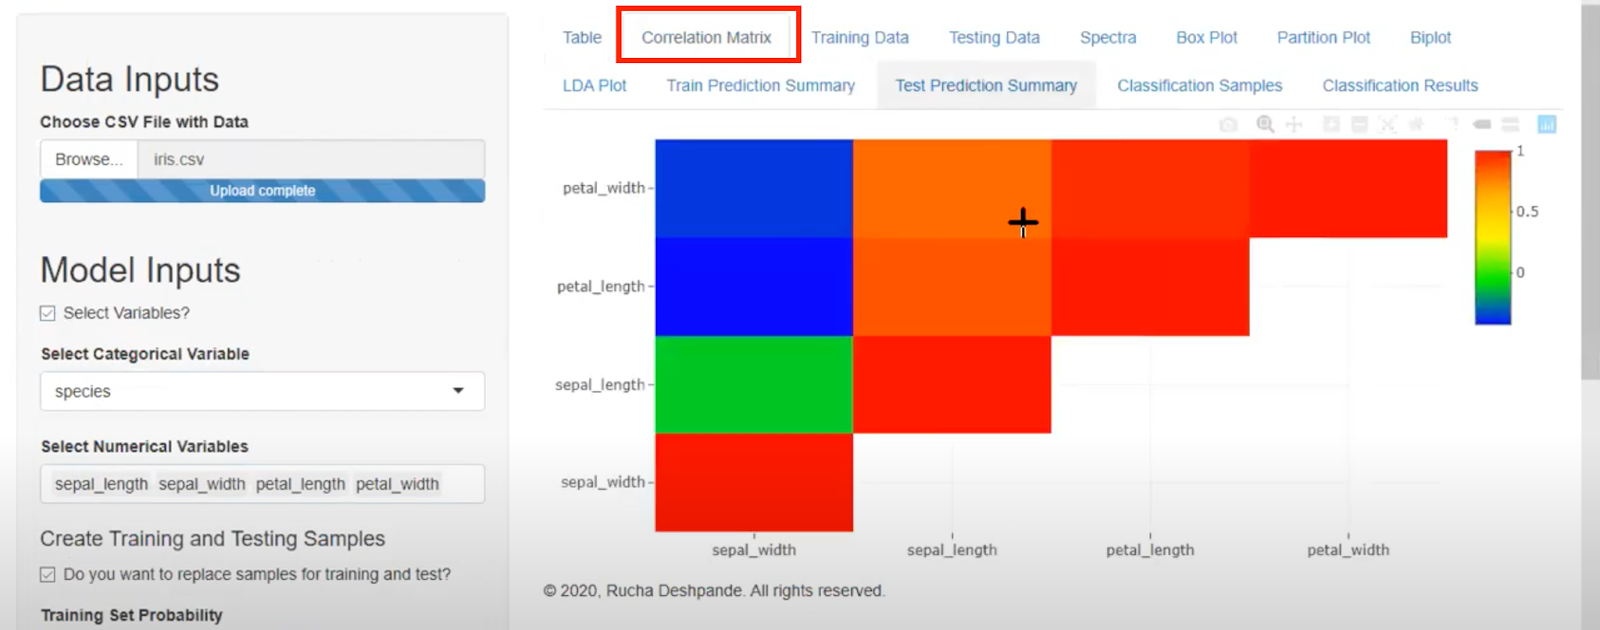
Provide the user with a correlation matrix to predict the relationship between variables from the dataset.
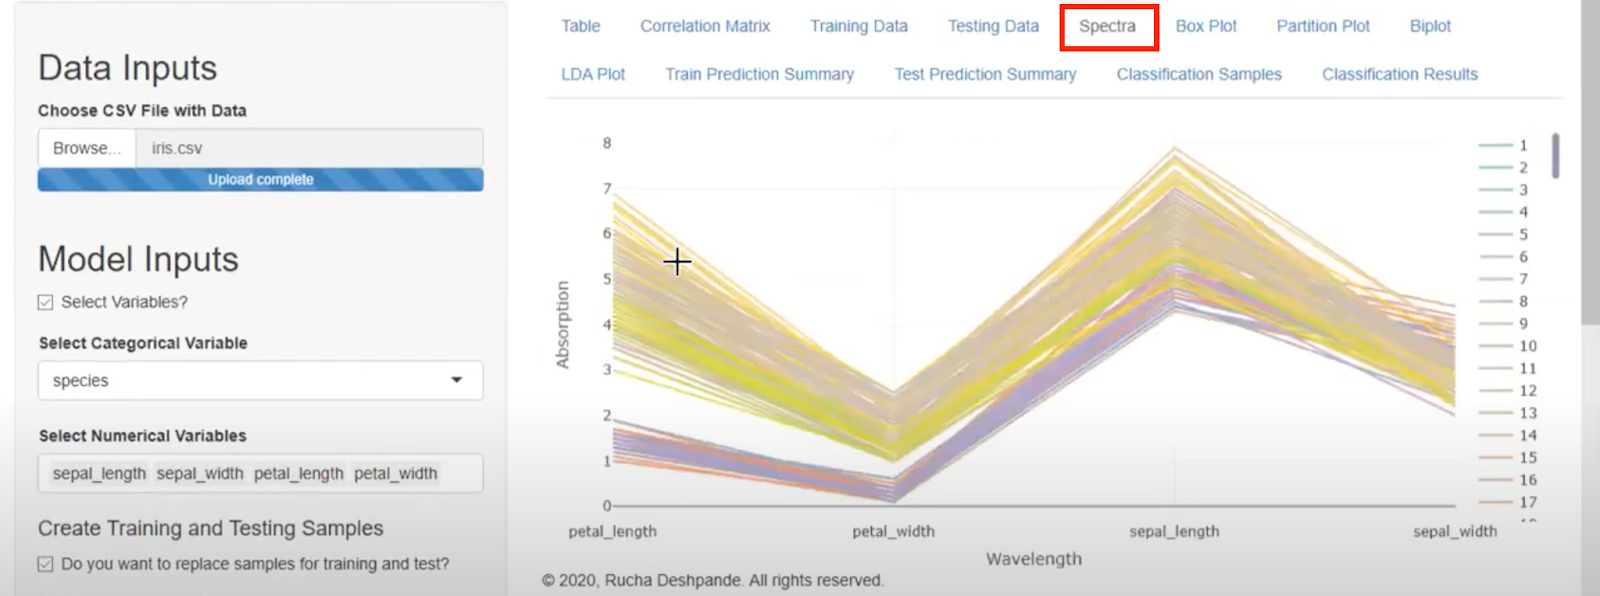
niceLDA also provides the feature of “Spectra” for the spectroscopy view of the data if the dataset supports the spectroscopy view.
Shows the Test dataset and Training Dataset on the basis of the Test-Training dataset ratio/probability for better view and understanding in tabular form.
niceLDA provides the beautified Boxplot view for the distribution of various values and compares multiple groups

niceLDA also provides us with the “Partition Plot” view which shows the app errors and different partitions of the variables in different axis

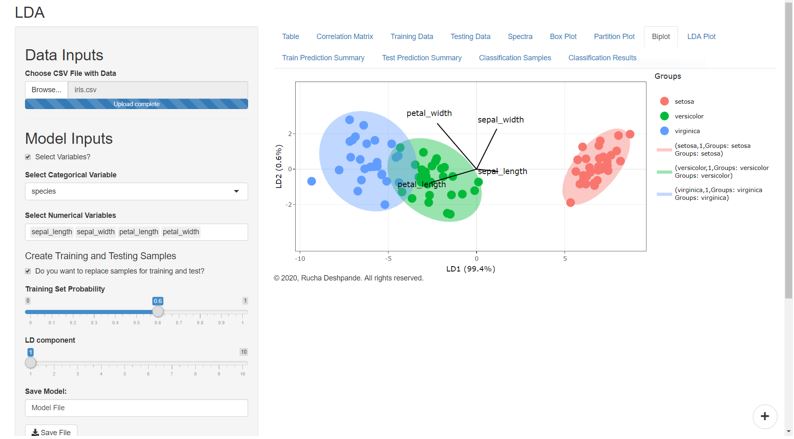
niceLDA has a feature of BiPlot which allows information on both samples and variables of a data matrix to be displayed graphically
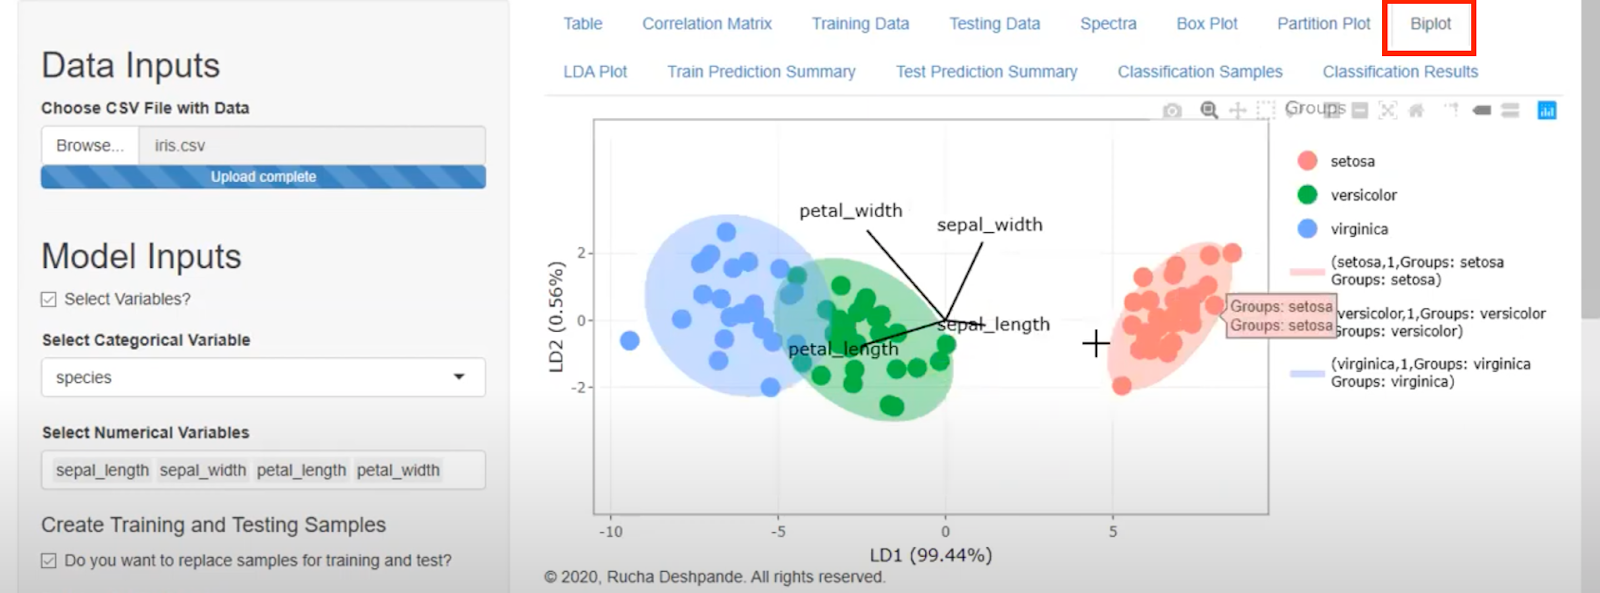
LDA PLot view provides an amazing graphical view that shows if the grouping patterns in the data are well separated

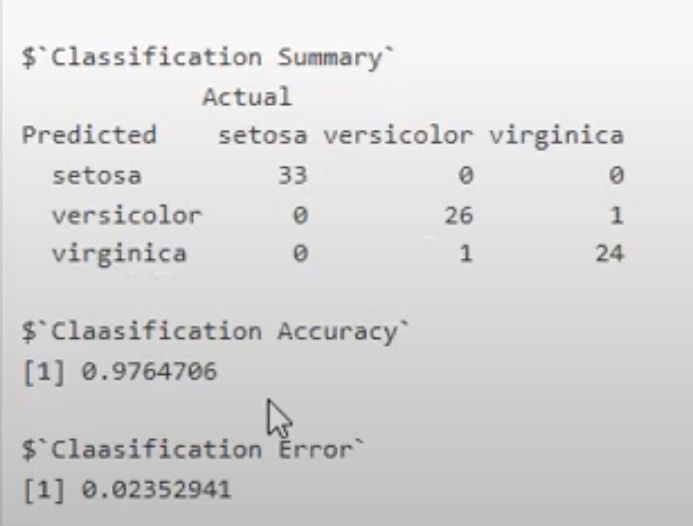
niceLDA also provides the user with a “Train Prediction Summary” and “Test Prediction Summary” on the basis of the model, which allows the user to get individual actual and predicted values of the dataset in a simplified tabular view

Classification Summary is also shown in the model for actual and predicted values for better analytics of the dataset.
This Platform allows the user to save the predicted and trained dataset and even allows to upload the recently used trained dataset on the niceLDA model from the user storage

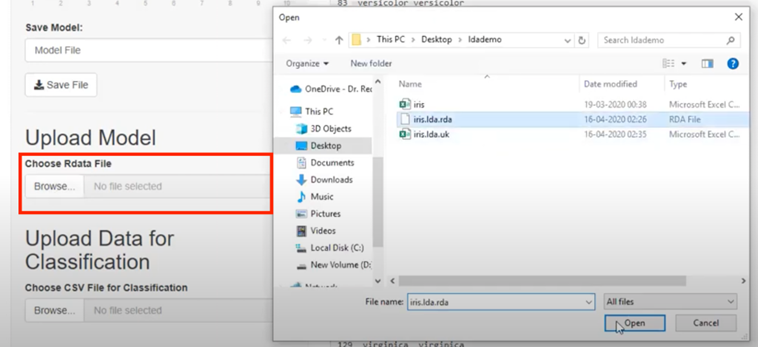
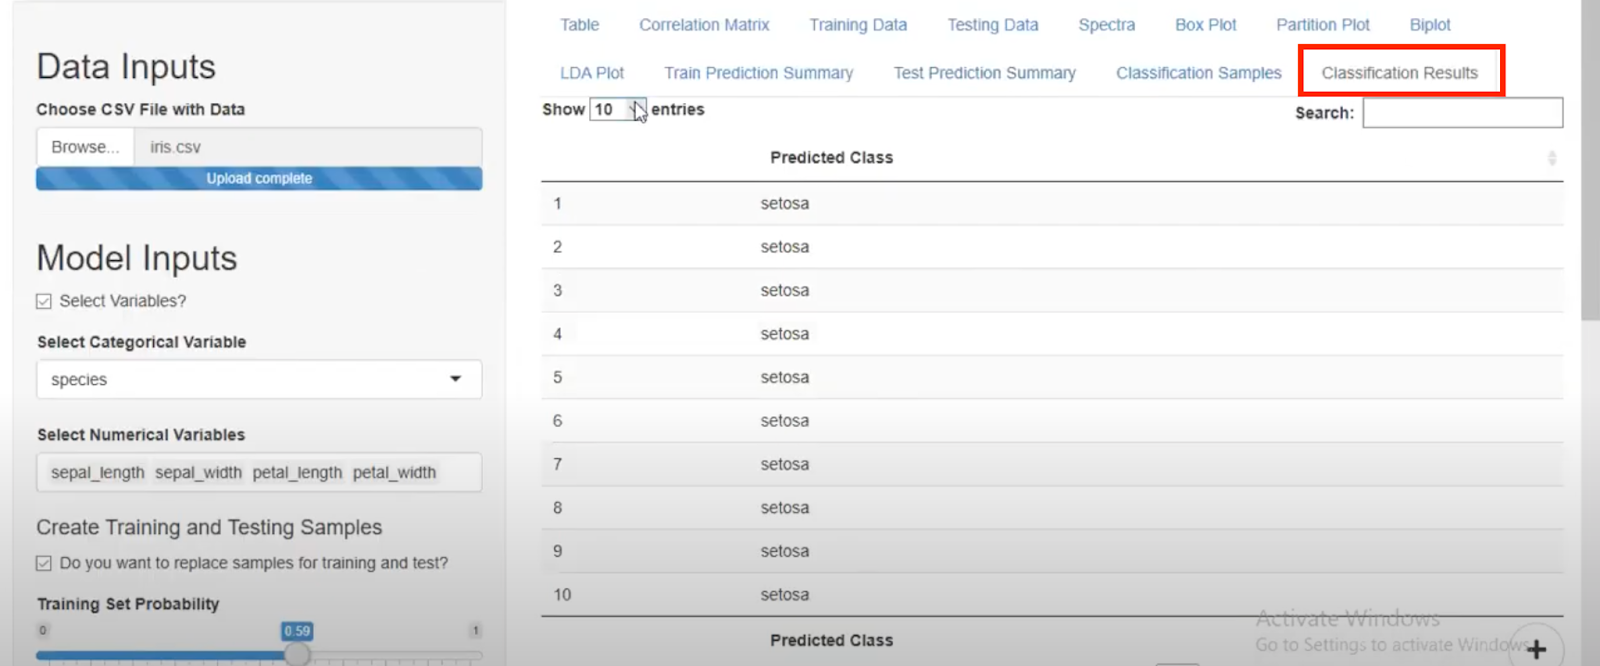
Classification Results” shows the Predicted Values for the dataset for the forecasting
Interested in exploring data analytics case studies using niceLDA? Download our free data analytics case studies here Or purchase our Data Analytics Case Studies e-Book on Amazon.