Statistical Process Monitoring of Critical Attributes
INTRODUCTION
Statistical Process Monitoring is useful to verify that the critical quality attributes are strictly controlled within the specified limits. Statistical control charts, process capability analysis, etc. are the most commonly used tools for process monitoring, root cause analysis, and process improvements required in CPV. In this article, we will be focusing on the statistical control charts that are frequently used for verifying that the process remains in a state of statistical control.
According to USFDA guidance on process validation (2011), one-time demonstration of process reproducibility before start of the commercial manufacture is inadequate but there should be a continual assurance of the reproducibility throughout the entire process life cycle. This continual assurance that the process remains in the state of validation during the commercial manufacture is known as Continual Process Verification (CPV). The ultimate objective of a CPV program is to identify the parameters for trends, detect signals for out-of-specification (OOT) events and implement a Corrective and Preventive Actions (CAPA).
WHAT IS A CONTROL CHART?
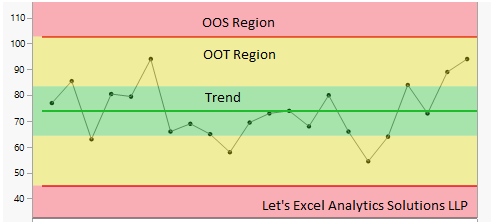
Control chart (Syn. Shewhart chart/Statistical process control chart) is a graphical representation of a process over time. It has a line for process average above and below of which are upper and lower bounds of the process respectively. The average line, and upper and lower limits are drawn from historical data. The process is considered to be in a state of statistical control as long as the current data falls between the upper and lower bounds of the chart. Figure below shows how a typical control chart looks like.
Types of control charts
I. Univariate control charts for Process Monitoring
II. Multivariate control charts Process Monitoring
- Hotelling T2 chart
- Multivariate Exponentially Weighted Moving Average (MEWMA) chart.
- Multivariate Cumulative Sum of Deviations chart.
UNIVARIATE CONTROL CHARTS
Univariate control charts are used to monitor processes with a single independent or multiple uncorrelated variables. Most common univariate control charts are discussed below.
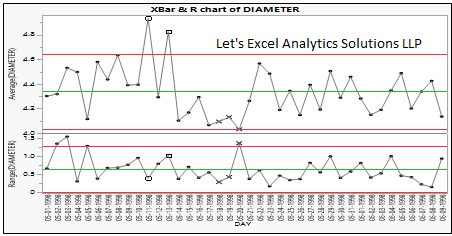
- Xbar and range chart is a pair of control charts that shows how process average changes over time (Xbar) and how the range (max – min) changes over time (R chart). The measurements performed at a given time constitute a subgroup. The upper and lower bounds are determined by multiplying the Xbar and R with an appropriate constant. These charts are very useful to find out if the process is stable and predictable.
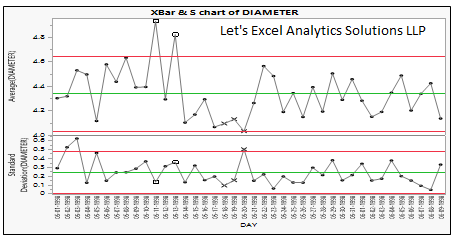
- Xbar and standard deviation chart is, again, a pair of charts that shows how process average and standard deviation changes over time. The average and standard deviation are used to estimate the upper and lower bounds of the process. These charts are used when subgroup size is large (n>10). It is believed that standard deviation provides better understanding of the process variations than the range.
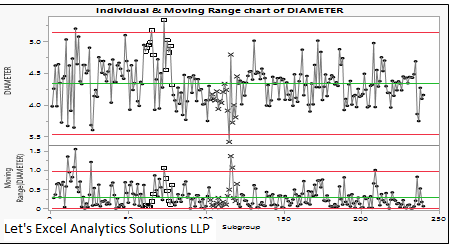
- Individual and moving range chart is a pair of charts that shows individual values and their moving average over time; moving average is the average between two successive data points. The average value and bounds of the process are determined from the average and standard deviation of the individual values of the historical data.
As long as all the subgroups remain within the upper and lower bounds, the process is said to be in a state of statistical control, i.e., only common cause variations are present. If there is a pattern or the current subgroup falls outside the bounds of the process, the variation is caused by an assignable cause and has to be closely monitored and investigated.
However, univariate control charts could be misleading in case of multivariate processes particularly when the variables are dependent and correlated. In such cases, multivariate statistical tools are used to develop control charts.
MULTIVARIATE CONTROL CHARTS
Univariate charts cannot be used for processes with two or more correlated variables. For that matter, multivariate control charts are used to determine how correlated variables jointly affect the process outcomes. For the limited scope of this blog, we have restricted our discussion to T2 Hotelling charts.
Hoteling’s T2 chart Process Monitoring
This control chart is named after Harold Hotelling who developed a statistics where multiple correlated variables could be plotted on a single chart, known as Hotelling’s T2 chart. The variables could be either individual observations or subgroups. Generally, historical data is used to develop a target statistic for comparison with the current or future data. However, if it is constructed using current data alone, the control chart is known as Phase I chart; whereas if it is constructed using historical data, the control chart is known as Phase II. This chart can detect excursions in means and identify associations between correlated variables.
Hotellings T2 statistics Process Monitoring
Suppose x1 and x2 be two critical quality attributes that follow bivariate normal distribution. Let µ1 and µ2 be the mean values and σ1 and σ2 be the standard deviations of the attributes. Let ẍ1 and ẍ2 be the sample averages computed from the samples of size n. The covariance matrix of x1 and x2 is denoted by σ12. T2 statistics (χ02) of the distribution is given by the following formula:
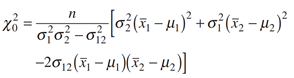
This equation is used as a basis of creating Hoetlling’s control chart for the process means µ1 and µ2. This equation indicates that as long as the process means remain around µ1 and µ2, the value of χ02will be less than upper control limit (UCL). If the mean value of at least one of the attributes is out-of-control limit, χ02 exceeds the UCL. The UCL is the upper α percentage point of the distribution with k degrees of freedom. The process monitoring is represented graphically as shown in figure below.
Model driven multivariate control charts (MDMVCC)
MDMVCC is a control chart that is built based on either principal components (inputs only) or partial least squares (inputs and outputs) models. It is used to monitor a multivariate process using T2 Hoellistic chart. In case of an out-of-specification event, the model enables identification of the root cause and contribution of the individual variables to the event.
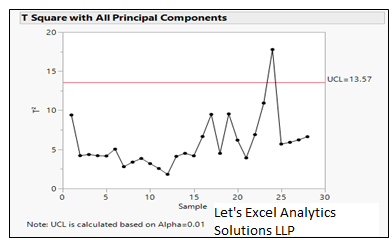
T2 Hoellistic chart is plotted using the model led principal components or x scores of the prediction (in case of PLS) of the historical data. The limit (upper only) of the control chart is then determined using the following formula:
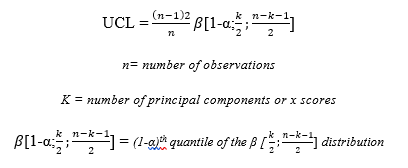
Then, the current data is incorporated into the chart for the comparability analysis. However, the current data has a separate upper limit calculated using the following formula:
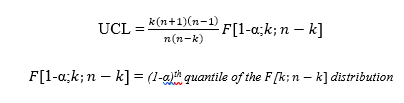
The process is in a state of control as long as it stays below the Upper Control Limit (UCL) in the T2 chart. If a user detects an out-of-control signal, then it is possible to identify the root cause by leveraging the predictability of the model. The user can determine the individual contribution of each variable for the implementation of the appropriate corrective and preventive actions.
CONCLUSION
In conclusion, statistical control charts are most important process monitoring quality tools that ensure the state of validation throughout the process and product life cycle. These charts have evolved dramatically over the years from just univariate tools to multivariate and statistical model-driven tools. These charts don’t help only in detecting the out-of-control signals but also identifying the assignable causes behind the signal.
Curious to know more?