Chemometrics and How to Use It?
Introduction
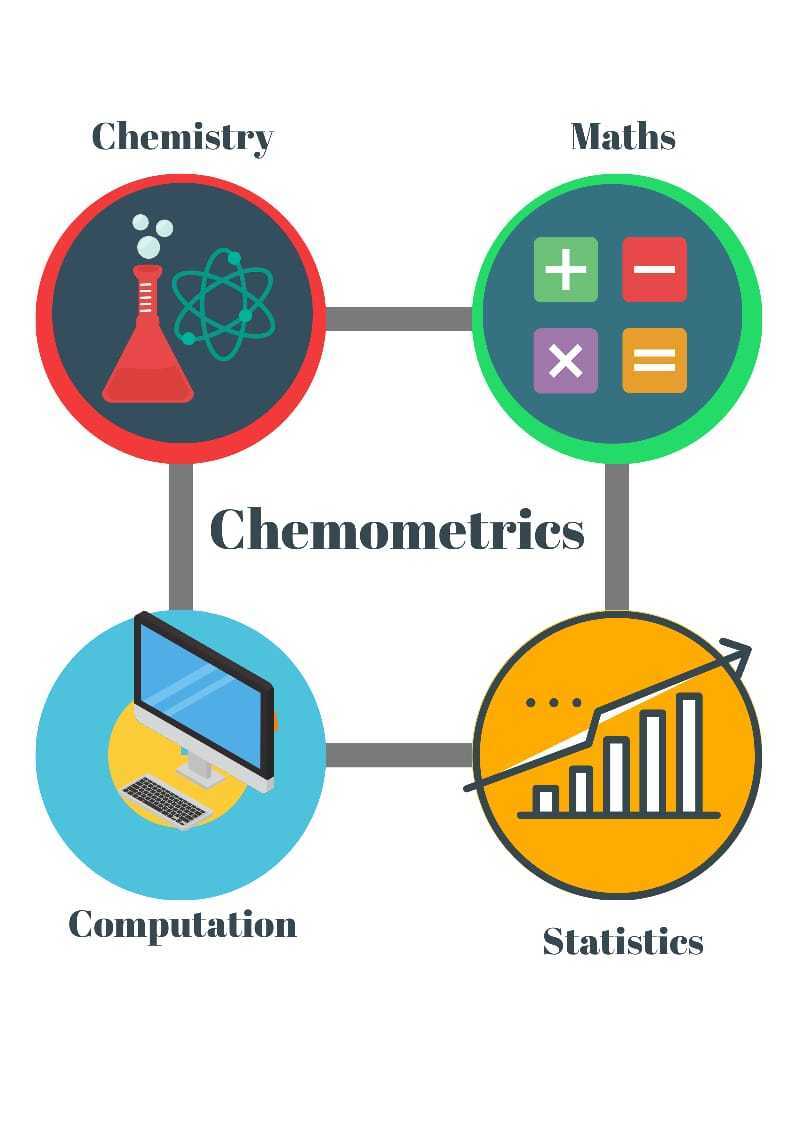
“Chemometrics” is a combination of two words “chemo” and “metrics” which signifies the application of computational tools to Chemical Sciences. Coined by a Swedish Scientist, Svante Wold, in 1972. Later in 1974, Svante Wold and Bruce Kowalski founded the International Chemometrics Society (ICS). ICS describes chemometrics as the chemical discipline that uses mathematical and statistical models to
a) design or select optimal measurement procedures and experiments, and
b) to provide maximum chemical information by analyzing chemical data.
How does Chemometrics help design optimal experiments
Classical chemistry depends on the conventional One-factor-at-a-time (OFAT) for building on the understanding of the process chemistry, performance of the process, and product characterizations. However, these conventional techniques suffer from many drawbacks such as:
- OFAT studies are time-consuming and need a greater number of experimental
- It does not give any information about potential interactions between the two or more factors, and
- OFAT studies may or may not give the optimal settings for the process or the product attributes.
The chemometrics, in turn, employs multivariate mathematical and statistical tools in combination with computational techniques to investigate the effect of multiple factors on the optimality of the process and product attributes. The multivariate data is modeled into a mathematical equation that can predict the best optimal settings for the process and the effect of the excursions of the process parameters on the process performance and the product quality.
The outcome of the multivariate investigation allows identification of the multidimensional design space within which the process is not impacting the process performance and product quality attributes. Moreover, multivariate strategies cover multiple process insights into a single multivariate design of the experiment. The adoption of the multivariate design of experiments offers multiple advantages over the conventional OFAT like:
- Reduces the product development timelines significantly,
- Significantly reduce the product development costs in a highly competitive market.
- Maximizes the total information obtained from the experiment.
How does Chemometrics help derive maximum information from the chemical data?
The multivariate analysis strategy in the analysis of the chemical data starts with the pretreatment of the chemical data, also known as data preprocessing. It involves the approaches, where:
- The data is scaled and coded,
- Cleaned for outliers,
- Checked for errors and missing values, and
- Transformed, if need be, into a format that is explicitly comprehensible by the statistical and mathematical algorithms.
After the preprocessing of the data, the chemometric tools look for the patterns and informative trends in the data. This is referred to as pattern recognition. Pattern recognition uses machine learning algorithms to identify trends and patterns in the data. These machine learning algorithms, in turn, employ the historical data stored in the data warehouses to predict the possible patterns in the new set of data. The pattern recognition ML tools use either supervised or unsupervised learning algorithms. The unsupervised algorithms include Hierarchical Cluster Analysis (HCA) and Principal Components Analysis (PCA) whereas supervised algorithms have K Nearest Neighbours (KNN).
What are the Different Tools and Techniques used in Chemometrics?
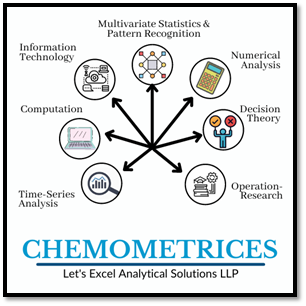
With advancements in time, chemometrics has added multiple feathers in its cap rather than being a single tool for its application in the Chemical Sciences. A wide variety of the disciplines that contributed to the advancements of the field of Chemometrics are shown in the figure below. It has been adding multiple techniques each time to expand its applicability in the Research & Development of the chemical sciences.
- Multivariate Statistics & Pattern Recognition in the Chemometrics
Multivariate statistical analysis refers to the concurrent analysis of multiple factors to derive the totality of the information from the data. The information derived may be the effect of individual factors, the interaction between two or more factors, and the quadratic terms of the factors. As multivariate data analysis involves estimation of almost all the possible effects in the data, these analysis techniques have very high precision and help make highly predictable conclusions. The multivariate statistical tools and techniques find plenty of applications in following industries:
- Pharma and Life Sciences
- Food and Beverages
- Agriculture
- Chemical
- Earth & Space
- Business Intelligence
Some of the most popular and commonly used multivariate modelling approaches are described briefly below.
- Principal Components Analysis
Data generated in chemometrics, particularly in spectroscopic analysis, is enormous. Such datasets are highly correlated and difficult to model. For that matter, Principal Components Analysis (PCA) creates new uncorrelated variables known as principal components. PCA is a dimensionality reduction technique that enhances the interpretability of large datasets by transforming large datasets into smaller variables without losing much of the information. Let’s Excel Analytics Solutions LLP offers a simple yet highly capable web-based platform for PCA, branded as the MagicPCA.
- Linear Discriminant Analysis
Linear discriminant analysis is another multivariate technique that is dependent on dimensionality reduction. However, in LDA the dependent variables are categorical variables and the independent variables could be in the form of intervals. The LDA focuses on establishing a function that can distinguish between different categories of the independent variables. This helps identify the sources of maximum variability in the data. Our experts at Let’s Excel Analytics Solutions LLP have developed an application, namely niceLDA, that can solve your LDA problems.
- Partial Least Squares
Partial Least Squares (PLS) is a multivariate statistical tool that bears some resemblance with the Principal Components Analysis. It reduces the number of variables to a smaller set of uncorrelated variables and subsequently performs linear regression on them. However, unlike linear regression, PLS fits multiple responses in a single model. Our programmers at Let’s Excel Analytics Solutions LLP have developed a user-friendly web-based application for partial least square regression, EasyPLS.
Application of Chemometrics in Analytical Chemistry
Chemometrics finds its application throughout the entire lifecycle of the Analytical Sciences right from the method development and validation, development of the sampling procedure, exploratory data analysis, model building and, predictive analysis. The analytical data generated has a multivariate nature and depends on the multivariate data analysis (MVDA) for the exploratory analysis and predictive modeling. The three main areas of the Analytical Sciences where Chemometrics has demonstrated its advantages over the conventional techniques include:
- Grouping or cluster analysis refers to a group of analyses where a data set is divided into various clusters in such a way that each cluster has a unique and peculiar property that differs from another set of clusters. A widely known example of cluster analysis is used in flow cytometric analysis of cell viabilities where cells are clustered based on the apoptotic markers. Principal Component Analysis can be used as a powerful tool for understanding the grouping patterns.
- Classification analysis is defined as a systematic categorization of chemical compounds based on known physicochemical properties. This allows for the exploration of the alternatives for a known chemical compound with similar physicochemical properties. For example, in the development of the HPLC method for polar and aromatic compounds, data mining for the corresponding solvents can be done by looking into polar and aromatic classes of the solvents. This can be done by building SIMCA models on top of the Principal Component Analysis.
- Calibration of the analytical methods: chemometrics-assisted calibration of analytical methods employ multivariate calibration models where multiple, sometimes hundreds, analytes are calibrated at the same time. These multivariate calibration models have many advantages over the conventional univariate calibration models. The major advantages include:
- significant reduction of noise,
- non-selectivity of the analytical methods,
- dealing with interferents and,
- outliers can be detected and excluded in the first place.
- The Principal Components Analysis and Partial Least Squares are the most commonly used chemometrics tools that are used for developing multivariate calibration models in the development of analytical methods for pharmaceuticals, foods, environmental monitoring, and forensic sciences. The chemometric tools have widely transformed the discipline of the Analytical Sciences by building highly reliable and predictive calibration models, providing tools that assist in their quantitative validations, and contributing to their successful application in highly sensitive chemical analyses.
Application of Chemometrics in Studying QSAR in Medicinal Chemistry
QSAR stands for “quantitative structure and activity relationship” and refers to the application of a wide variety of computational tools and techniques used to determine the quantitative relationship between the chemical structure of a molecule and its biological activities. It is based on the principle that each chemical moiety is responsible for a certain degree of biological activity in a chemical molecule and influences the activity of other moieties in the same molecule. In other words, the similarities in the structure of two chemical molecules could correspond to their similarities in biological activities. This forms a basis for predicting the biological activities of new drug molecules in medicinal chemistry.
For QSAR modeling, certain features of a chemical molecule that can potentially affect the biological activities are referred to as molecular descriptors. These molecular descriptors are classified into five major categories and include physicochemical, constitutional, geometric, topological, and quantum chemical descriptors. The biological activities of interest in QSAR correspond to the pharmacokinetic, pharmacodynamic, and toxicological properties of the molecule. Each of the molecular descriptors is referred to as the predictor and the corresponding biological activity as the response. The predictors are then modeled into a mathematical equation using multivariate statistical tools. There are two widely accepted statistical models used for predicting the QSAR of a new molecule and include regression and classification models. The regression models used are multiple linear regression (MLR), principal components regression (PCR), and Partial Least Square regression (PLS). Let’s Excel Analytics Solutions LLP has developed user-friendly interfaces for performing all these operations.
QSAR also has extended its approaches to other fields like chromatography (Quantitative Structure and Chromatography Relationship, QSCR), toxicology (Quantitative Structure and Toxicity Relationship, QSTR), biodegradability (Quantitative Structure and Biodegradability Relationship, QSBR), electrochemistry (Quantitative Structure and Electrochemistry Relationship, QSER) and so on.
Conclusion
Chemometrics has changed the way of designing and developing chemical processes. The information obtained from chemical data has maximized the degree to which processes can be optimized. It has also contributed significantly to the development of highly sensitive and accurate analytical methods by simplifying the complex amount of data generated during the development, calibration, and validation of the analytical data. In general, chemometrics is an ever-expanding domain that is constantly diversifying its applications in a wide variety of fields.
Let’s Excel Analytics Solutions LLP has a proven track record of developing highly reliable chemometric applications that can help you make better business decisions. If you are dealing with a complex problem and looking for the right solution, schedule a free consultation now!