Data Visualization

Data Visualization using Box-Plot

Data visualization is the first step in data analysis. DataPandit allows you to visualize boxplots as soon as you segregate categorical data from numerical data. However, the box plot does not appear until you uncheck  ‘Is this spectroscopic data?’ option in the sidebar layout, as shown in Figure 1.  The box plot is also known […]

Correlation Matrix

How to use the Correlation Matrix?

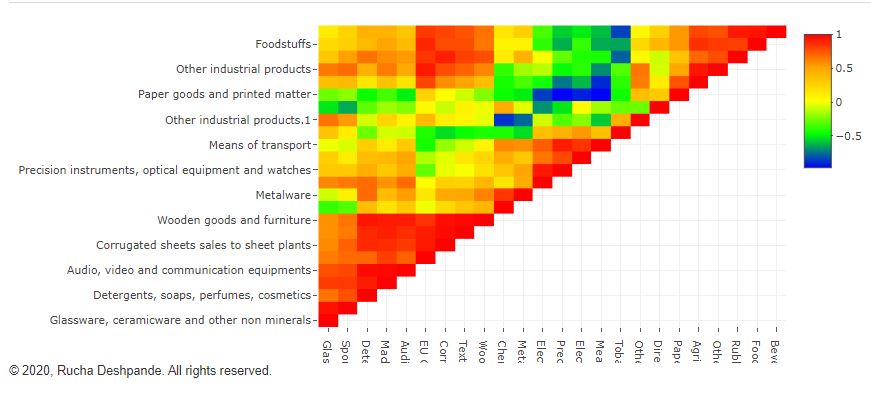
The correlation matrix in DataPandit shows the relationship of each variable in the dataset with every other variable in the dataset. It is basically, a heatmap of Pearson correlation values between corresponding variables. For example, in the correlation matrix above, the first element on X-axis is high_blood_pressure while that on the Y-axis is high_blood_pressure too. […]

Pearson's correlation Matrix

What is Pearson’s Correlation Co-efficient?

Introduction Pearson’s correlation is a statistical measure of the linear relationship between two variables. Mathematically,  it is the ratio of covariances of the two variables And the product of their standard deviations. Therefore the formula for Pearson’s correlation can be written as follows: The result for Pearson’s correlation always varies between -1 and + 1. […]

Finding the Data Analytics Method that Works for You

Last week I met John, a process expert who works at a renowned cosmetic manufacturing company. John was pretty frustrated over a data scientist who could not give him a plot using the data analytics technique of his choice. He was interested in showing grouping patterns in his data using PCA plots. When I got […]

What is Data Analytics as a Service?

Introduction Data Analytics is very diverse in the solutions it offers. It covers a range of activities that add value to businesses. It has secured a foothold in every industry that ever existed. Eventually carving a niche for itself known as Data Analytics as a Service (DAaaS) DAaaS is an operating model platform where a service […]

Internet Of Things-Few Insightful Facts

Introduction The internet has revolutionized our modern society. It has simplified everything that we do. It has brought us all the good things of the world at our fingertips. There has been a wave of internet transformation lately. The traditional internet has evolved into the Internet of Things(IoT) by convergence into diversified technologies. This evolution […]

Examples of Internet of Things

Introduction The application of the Internet of Things (IoT) is widely spread in all walks of our life. It creates an ecosystem where everything is connected and controlled using an application. This connectedness and remote control simplify and make our lives better. The basic idea behind the concept of the Internet of Things is already […]

Statistical Process Monitoring

Statistical Process Monitoring of Critical Attributes

INTRODUCTION Statistical Process Monitoring is useful to verify that the critical quality attributes are strictly controlled within the specified limits. Statistical control charts, process capability analysis, etc. are the most commonly used tools for process monitoring, root cause analysis, and process improvements required in CPV. In this article, we will be focusing on the statistical […]

Computational Techniques in Medicine

Computational Techniques in Medicine

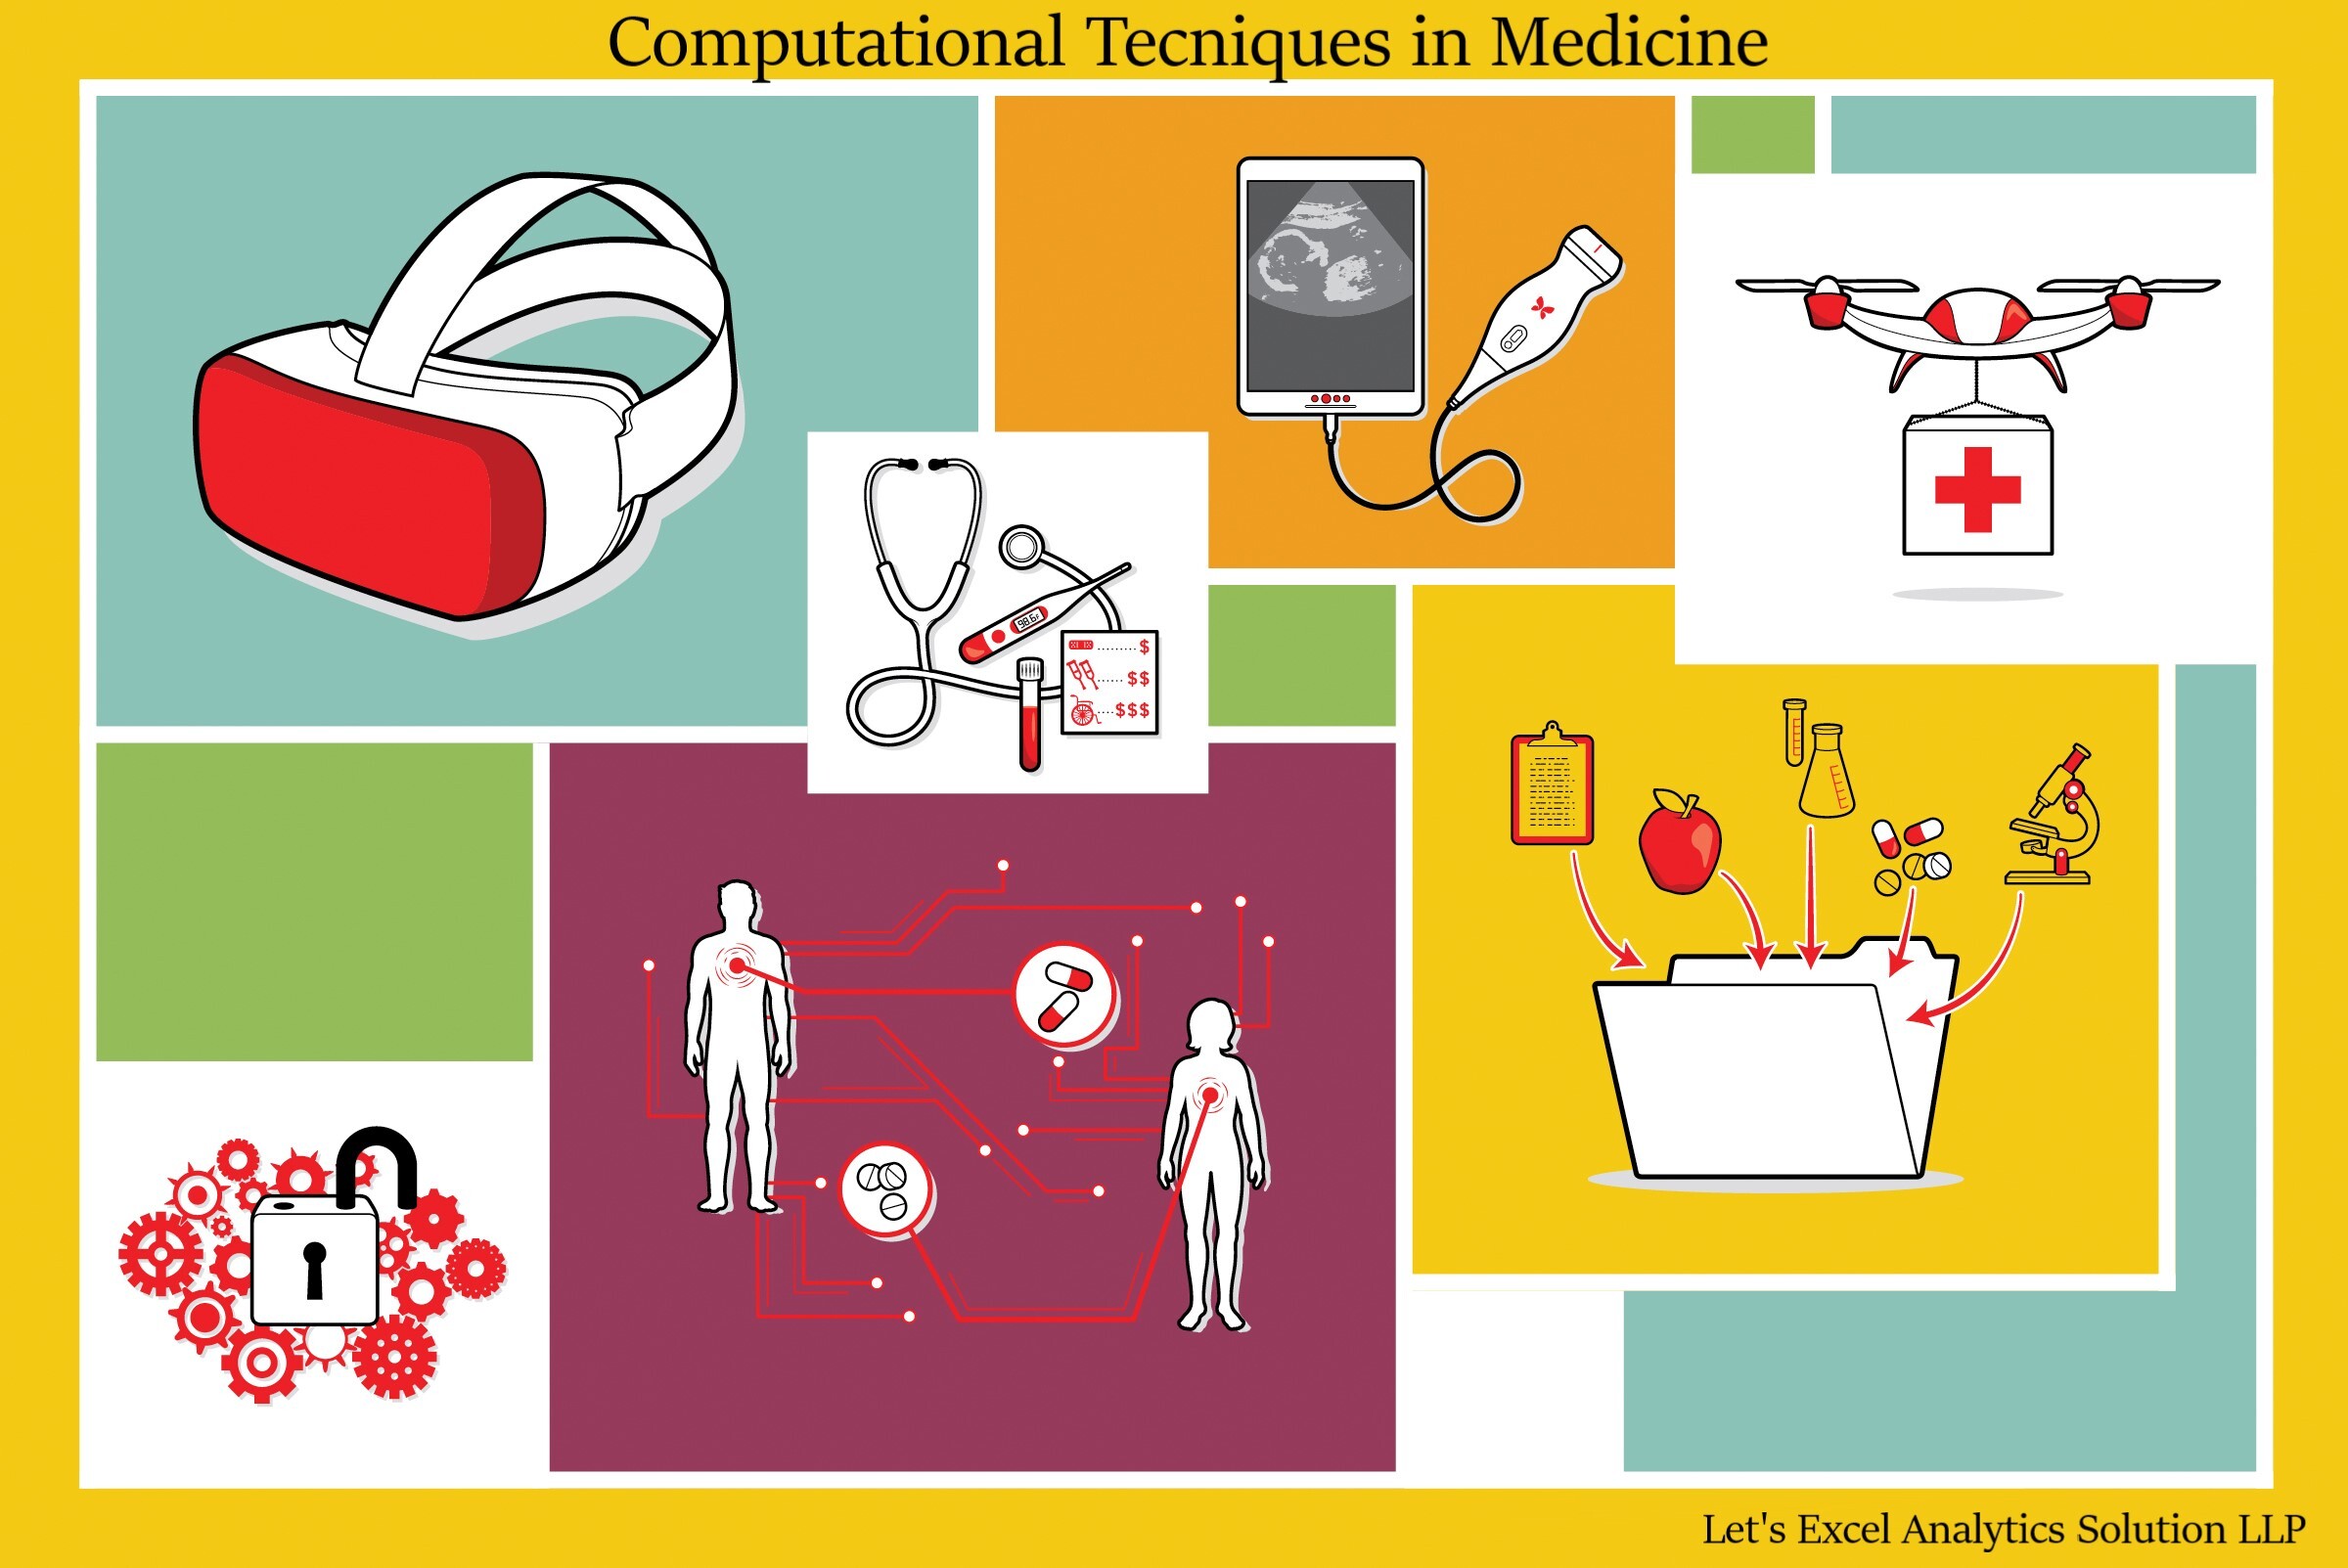
What are Computational Techniques? Computational Techniques are quick, easy, reliable, and efficient methods for solving mathematical, scientific, engineering, geometrical, geographical, and statistical problems. These techniques invariably utilize computers, and hence the name. They are specifically, steps or algorithm-based execution for achieving a solution to the problems. In other words, computational Techniques deliver solutions using mathematical […]